Mutation of a phosphorylatable residue in Put3p affects the magnitude of rapamycin-induced PUT1 activation in a Gat1p-dependent manner
- PMID: 19574222
- PMCID: PMC2782005
- DOI: 10.1074/jbc.M109.030361
Mutation of a phosphorylatable residue in Put3p affects the magnitude of rapamycin-induced PUT1 activation in a Gat1p-dependent manner
Abstract
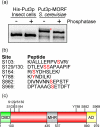
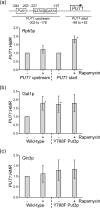
Saccharomyces cerevisiae can utilize high quality (e.g. glutamine and ammonia) as well as low quality (e.g. gamma-amino butyric acid and proline) nitrogen sources. The transcriptional activator Put3p allows yeast cells to utilize proline as a nitrogen source through expression of the PUT1 and PUT2 genes. Put3p activates high level transcription of these genes by binding proline directly. However, Put3p also responds to other lower quality nitrogen sources. As nitrogen quality decreases, Put3p exhibits an increase in phosphorylation concurrent with an increase in PUT gene expression. The proline-independent activation of the PUT genes requires both Put3p and the positively acting GATA factors, Gln3p and Gat1p. Conversely, the phosphorylation of Put3p is not dependent on GATA factor activity. Here, we find that the mutation of Put3p at amino acid Tyr-788 modulates the proline-independent activation of PUT1 through Gat1p. The phosphorylation of Put3p appears to influence the association of Gat1p, but not Gln3p, to the PUT1 promoter. Combined, our findings suggest that this may represent a mechanism through which yeast cells rapidly adapt to use proline as a nitrogen source under nitrogen limiting conditions.
Figures


Similar articles
-
Rapamycin treatment results in GATA factor-independent hyperphosphorylation of the proline utilization pathway activator in Saccharomyces cerevisiae.Eukaryot Cell. 2003 Jun;2(3):552-9. doi: 10.1128/EC.2.3.552-559.2003. Eukaryot Cell. 2003. PMID: 12796300 Free PMC article.
-
The regulator of the yeast proline utilization pathway is differentially phosphorylated in response to the quality of the nitrogen source.Mol Cell Biol. 2000 Feb;20(3):892-9. doi: 10.1128/MCB.20.3.892-899.2000. Mol Cell Biol. 2000. PMID: 10629046 Free PMC article.
-
Ammonia regulates VID30 expression and Vid30p function shifts nitrogen metabolism toward glutamate formation especially when Saccharomyces cerevisiae is grown in low concentrations of ammonia.J Biol Chem. 2001 Aug 3;276(31):28659-66. doi: 10.1074/jbc.M102280200. Epub 2001 May 16. J Biol Chem. 2001. PMID: 11356843 Free PMC article.
-
Modulation of transcription factor function by an amino acid: activation of Put3p by proline.EMBO J. 2003 Oct 1;22(19):5147-53. doi: 10.1093/emboj/cdg480. EMBO J. 2003. PMID: 14517252 Free PMC article.
-
Transmitting the signal of excess nitrogen in Saccharomyces cerevisiae from the Tor proteins to the GATA factors: connecting the dots.FEMS Microbiol Rev. 2002 Aug;26(3):223-38. doi: 10.1111/j.1574-6976.2002.tb00612.x. FEMS Microbiol Rev. 2002. PMID: 12165425 Free PMC article. Review.
Cited by
-
Purification and characterization of Put1p from Saccharomyces cerevisiae.Arch Biochem Biophys. 2010 Jun 15;498(2):136-42. doi: 10.1016/j.abb.2010.04.020. Epub 2010 May 5. Arch Biochem Biophys. 2010. PMID: 20450881 Free PMC article.
-
Role of Proline in Pathogen and Host Interactions.Antioxid Redox Signal. 2019 Feb 1;30(4):683-709. doi: 10.1089/ars.2017.7335. Epub 2018 Feb 2. Antioxid Redox Signal. 2019. PMID: 29241353 Free PMC article. Review.
-
L-Proline uptake in Saccharomyces cerevisiae mitochondria can contribute to bioenergetics during nutrient stress as alternative mitochondrial fuel.World J Microbiol Biotechnol. 2014 Jan;30(1):19-31. doi: 10.1007/s11274-013-1415-0. Epub 2013 Jul 4. World J Microbiol Biotechnol. 2014. PMID: 23824663
-
Put3 Positively Regulates Proline Utilization in Candida albicans.mSphere. 2017 Dec 13;2(6):e00354-17. doi: 10.1128/mSphere.00354-17. eCollection 2017 Nov-Dec. mSphere. 2017. PMID: 29242833 Free PMC article.
-
Untargeted metabolomics unravels functionalities of phosphorylation sites in Saccharomyces cerevisiae.BMC Syst Biol. 2016 Nov 15;10(1):104. doi: 10.1186/s12918-016-0350-8. BMC Syst Biol. 2016. PMID: 27846849 Free PMC article.
References
Publication types
MeSH terms
Substances
Grants and funding
LinkOut - more resources
Full Text Sources
Molecular Biology Databases
Research Materials

