. 2009 Sep 11;284(37):25065-76.
doi: 10.1074/jbc.M109.007054. Epub 2009 Jul 1.

The functional curli amyloid is not based on in-register parallel beta-sheet structure

Affiliations

The functional curli amyloid is not based on in-register parallel beta-sheet structure

Frank Shewmaker et al. J Biol Chem. .

Abstract

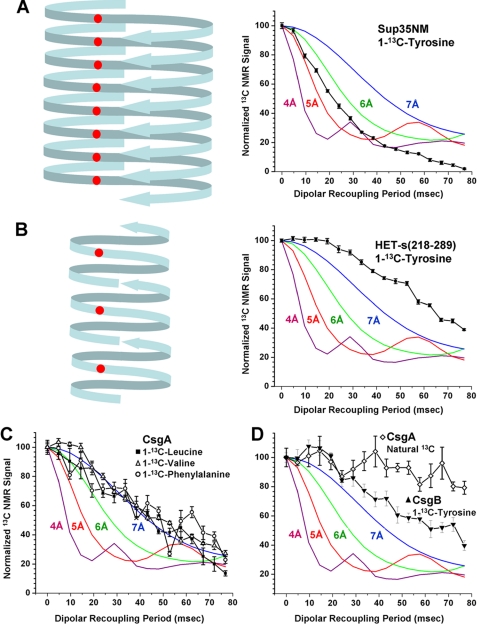
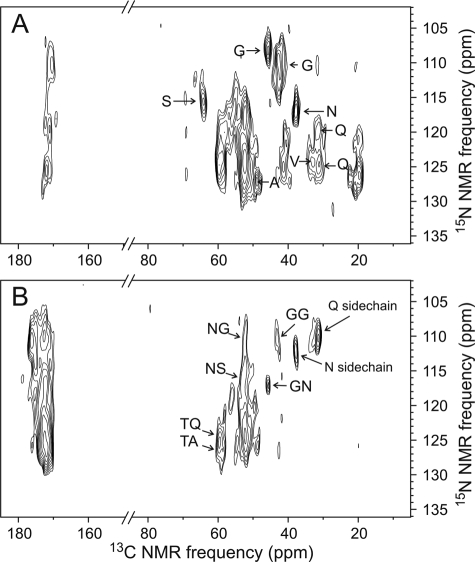
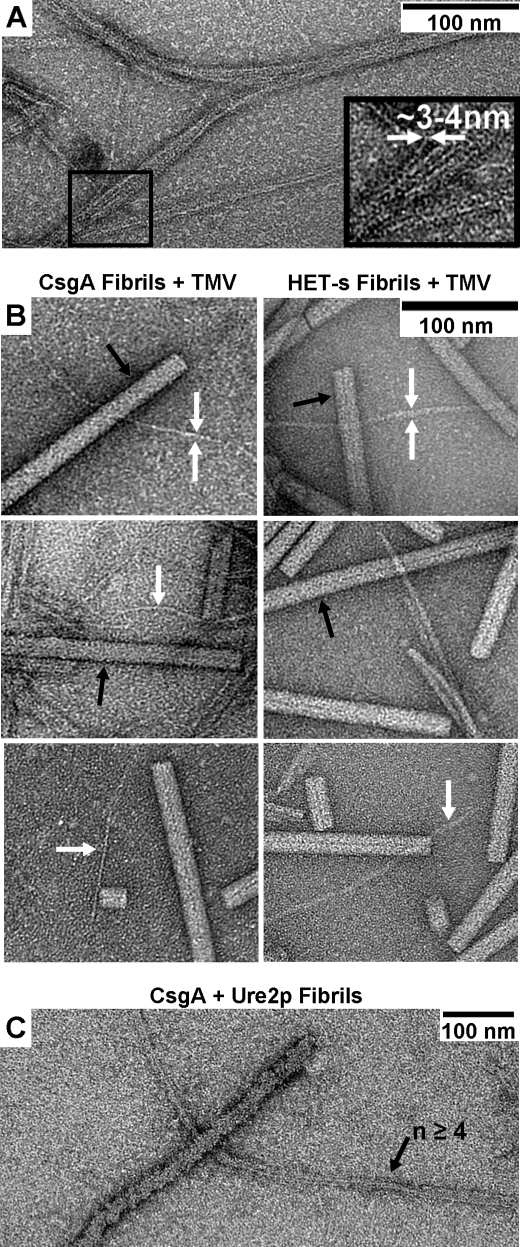
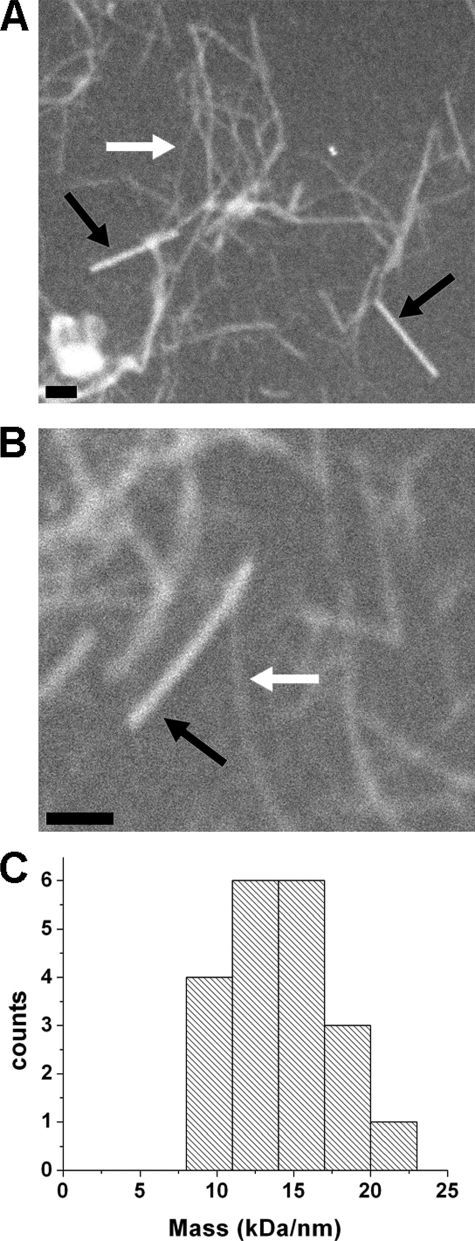
The extracellular curli proteins of Enterobacteriaceae form fibrous structures that are involved in biofilm formation and adhesion to host cells. These curli fibrils are considered a functional amyloid because they are not a consequence of misfolding, but they have many of the properties of protein amyloid. We confirm that fibrils formed by CsgA and CsgB, the primary curli proteins of Escherichia coli, possess many of the hallmarks typical of amyloid. Moreover we demonstrate that curli fibrils possess the cross-beta structure that distinguishes protein amyloid. However, solid state NMR experiments indicate that curli structure is not based on an in-register parallel beta-sheet architecture, which is common to many human disease-associated amyloids and the yeast prion amyloids. Solid state NMR and electron microscopy data are consistent with a beta-helix-like structure but are not sufficient to establish such a structure definitively.


Figures

FIGURE 1.
FIGURE 1.
Recombinant CsgA is correctly processed and forms SDS/urea-resistant fibrils. A, the primary sequence of CsgA is shown as coded by the pET expression plasmid pFPS149. Underlined amino acids indicate locations of specific carbonyl labeling with 13C for the PITHIRDS experiments. Amino-terminal sequencing of the purified product indicated that the protein was cleaved between Ala-20 and Gly-21 as indicated above (*). The theoretical mass of the processed protein with the histidine tag is 13916 Da. Mass spectrometry of purified CsgA indicated a mass of 13,918 Da for the unlabeled protein and 13,921 Da for the sample isotopically labeled at the three phenylalanine carbonyl positions. B, the electrophoretic migration of CsgA is slightly slower than would be predicted for its mass. Equal amounts of CsgA fibrils were treated with 88% formic acid (lanes 1 and 2) or with 8 m urea (lanes 3 and 4) prior to SDS-PAGE. C, electron micrographs of purified recombinant CsgA after incubation in Tris-saline buffer.
FIGURE 2.
FIGURE 2.
CsgA fibrils are rich in β-sheet and have increased protease resistance. A, x-ray diffraction of dried CsgA fibrils indicates atomic spacing of ∼0.48 (upper arrow) and ∼0.9 nm (lower arrow). B, dried CsgA fibrils were compared against dried BSA by circular dichroism spectroscopy. Based on curve fitting (20), the relative secondary structure contributions of CsgA fibrils are as follows: 16 ± 2% α-helix, 40 ± 2% β-sheet, 13 ± 2% β-turn, and 31 ± 2% remainder. C, equal concentrations of soluble and fibrous CsgA were exposed to Proteinase K for 0–20 min (′). mdeg, millidegrees.
FIGURE 3.
FIGURE 3.
CsgB and CsgB(Δ1–8) form SDS/urea-resistant fibrils. A, the primary sequence of CsgB as coded by plasmid pFPS186. A similar plasmid was constructed but with a disruption to the secretory sequence (pFPS184[CsgB(Δ1–8)]). Tyrosine residues (underlined) of CsgB were labeled with 13C at the carbonyl position for the PITHIRDS-CT experiments. B, fibrils were examined by SDS-PAGE: CsgB fibrils suspended in 8 m urea and 2% SDS without (lane 1) and with (lane 2) 88% formic acid pretreatment are shown; similarly CsgB(Δ1–8) is shown without (lane 3) and with (lane 4) pretreatment. C, electron micrograph (28,000× direct magnification) of CsgB fibers after 1 day in Tris-saline buffer. D, CsgB(Δ1–8) fibers after 1 day.
FIGURE 4.
FIGURE 4.
CsgB fibrils have features characteristic of amyloid. A, thioflavin-T fluorescence assay comparing CsgB(Δ1–8) fibrils with fibrils of the prion protein Ure2p and soluble BSA. λex = 420 nm. B, dried CsgB fibrils were compared against dried BSA using solid state circular dichroism spectroscopy. The relative secondary structure contributions of CsgB fibrils are predicted as follows: 7 ± 1% α-helix, 46 ± 1% β-sheet, 12 ± 1% β-turn, and 35 ± 2% remainder. C, x-ray diffraction of dried fibrils indicates that both CsgB and CsgB(Δ1–8) show characteristic atomic spacing of ∼0.47 (upper arrow) and ∼0.9 nm (lower arrow). mdeg, millidegrees.
FIGURE 5.
FIGURE 5.
Electron diffraction with fibrils of CsgB. A, non-aligned CsgB fibrils yield an ∼4.7-Å electron diffraction pattern (left image) from the region inside the dashed circle on the regular electron microscope image (right image). B, CsgB fibrils in the dashed circle show a similar orientation along the vertical direction (indicated with 0° arrow) and produce the diffraction pattern shown in the inset. The arrow in the diffraction inset indicates the corresponding orientation on the diffraction pattern. C, intensity of a single slice through the diffraction pattern of B indicating the increase of intensity at ∼4.7Å. D, angular dependence of the diffraction ring of B (integrated from 4.6 to 4.8 Å with 20° angular bins). The peak at 180° and minima at 90° and 270° indicate that the ∼4.7-Å distance is along the axis of the fibrils (cross-β structure). The solid line is drawn to guide the eye.
FIGURE 6.
FIGURE 6.
Solid state 13C one-dimensional NMR spectra of carbonyl-labeled CsgA and CsgB samples. A–D, the carbonyl signal from each labeled CsgA and CsgB fibril sample is shown. The chemical shift values are relative to tetramethylsilane and are presented with a dashed line indicating the random coil value for the carbonyl of the respective amino acid (36). E and F, the full carbon chemical shift spectra of the [1-13C]valine and unlabeled CsgA samples.
FIGURE 7.
FIGURE 7.
Dipolar recoupling NMR experiments indicate curli amyloid is not based on parallel in-register β-sheet structure. The graphs show 13C signal decays of specifically labeled carbonyl positions using the PITHIRDS-CT method. All graphs include simulated PITHIRDS-CT curves for ideal chains of 13C with spacing of 4.7 Å. A, [1-13C]tyrosine-labeled Sup35NM fibrils adjacent to a representative schematic of their in-register parallel β-sheet amyloid structure. B, [1-13C]tyrosine-labeled HET-s(218–289) fibrils adjacent to a representative schematic of their β-helix amyloid structure. C, CsgA fibrils separately labeled at the carbonyl positions of valine, leucine, or phenylalanine. The contributions of the adjacent valines at the amino terminus of the CsgA sequence were subtracted from the valine signal values with the assumption that they have signal decays similar to the simulated 3-Å dipole-dipole distance. D, [1-13C]tyrosine-labeled CsgB fibrils and unlabeled CsgA fibrils.
FIGURE 8.
FIGURE 8.
Two-dimensional 13C-13C spectra of uniformly 15N,13C-labeled CsgA fibrils. A, full two-dimensional spectrum obtained with a 2.37-ms fpRFDR mixing period at 13.50-kHz MAS frequency and 150.7-MHz 13C NMR frequency. CO/Cα cross-peaks of glycine residues and cross-peaks to side chain CO sites of asparagines/aspartate and glutamine/glutamate sites are indicated by arrows. B, one-dimensional slices of the two-dimensional spectrum taken at positions indicated by the color coding. C, expansion of the aliphatic region with color-coded paths indicating residue type assignments of cross-peaks to threonine, serine, valine, alanine, and isoleucine residues. Dashed red and purple lines indicate valine and alanine signals with non-β-strand chemical shifts. Chemical shifts in all other assignment paths are consistent with β-strand secondary structure. Cα/Cβ cross-peaks for asparagines/aspartate and glutamine/glutamate residues and Cα diagonal peaks for glycine residues are indicated by arrows. Asparagines/aspartate chemical shifts suggest non-β-strand secondary structure. D, aliphatic region of two-dimensional spectrum obtained with a 200-ms RAD mixing period. Cross-peaks attributable to polarization transfers between residues that occur as sequential pairs in the CsgA sequence are indicated for threonine/glutamine, threonine/alanine, alanine/serine, asparagine/serine, and glycine/asparagine pairs. The order of the two residues in each pair cannot be determined from this spectrum.
FIGURE 9.
FIGURE 9.
Two-dimensional 15N-13C spectra of uniformly 15N,13C-labeled CsgA fibrils. A, two-dimensional 15N-13Cα/13CX spectrum showing chemical shift correlations within individual residues. Residue type assignments to glycine, serine, alanine, valine, asparagine, and glutamine residues are shown based on their distinctive 13C NMR chemical shifts in Fig. 8. B, two-dimensional 15N-13CO/13CX spectrum showing correlations between backbone amide 15N chemical shifts of residue k and 13C chemical shifts of residue k − 1. Assignments to certain sequential residue pairs are based on 15N chemical shifts in A and 13C chemical shifts in Fig. 8. Intraresidue cross-peaks involving asparagine and glutamine side chain amides are also observed.
FIGURE 10.
FIGURE 10.
CsgA fibers are composed of narrow fibrils. A, at high magnification in negatively stained transmission electron microscopy images, CsgA fibers are seen to form from the lateral association of very small fibrils, which are 3–4 nm in diameter. B, comparison of the fibrils (white arrows) of both CsgA and the prion protein HET-s(218–289) with tobacco mosaic virus (TMV; black arrows). C, the bundled fibrils of CsgA are dwarfed by a single fibril of the prion protein Ure2p that is ∼25 nm in diameter (43). The respective molecular masses of CsgA, HET-s prion domain, and Ure2p are ∼14, 9, and 40 kDa.
FIGURE 11.
FIGURE 11.
Mass per length measurements of CsgA fibrils. A and B, dark field electron microscopy images of CsgA fibers and tobacco mosaic virus (black arrows); CsgA fibers are of a variety of widths because of lateral association of individual fibrils. Examples of the thinnest discernible CsgA fibrils are indicated with the white arrows. The scale bars represent 100 nm, respectively. C, distribution of the mass per length values of the thinnest CsgA fibrils.

References

    1. Virchow R. (1853) C. R. Acad. Sci. 37, 860–861
    1. Stefani M., Dobson C. M. (2003) J. Mol. Med. 81, 678–699 - PubMed
    1. Fowler D. M., Koulov A. V., Balch W. E., Kelly J. W. (2007) Trends Biochem. Sci. 32, 217–224 - PubMed
    1. Podrabsky J. E., Carpenter J. F., Hand S. C. (2001) Am. J. Physiol. Regul. Integr. Comp. Physiol. 280, R123–R131 - PubMed
    1. Mackay J. P., Matthews J. M., Winefield R. D., Mackay L. G., Haverkamp R. G., Templeton M. D. (2001) Structure 9, 83–91 - PubMed

Publication types

LinkOut - more resources