

Unite and conquer: univariate and multivariate approaches for finding differentially expressed gene sets
- PMID: 19574285
- PMCID: PMC2735665
- DOI: 10.1093/bioinformatics/btp406
Unite and conquer: univariate and multivariate approaches for finding differentially expressed gene sets
Abstract
Motivation: Recently, many univariate and several multivariate approaches have been suggested for testing differential expression of gene sets between different phenotypes. However, despite a wealth of literature studying their performance on simulated and real biological data, still there is a need to quantify their relative performance when they are testing different null hypotheses.
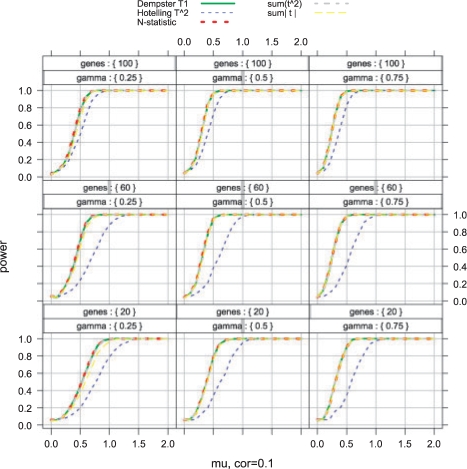
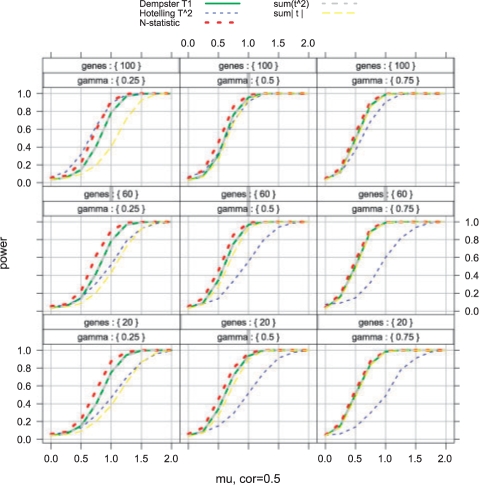
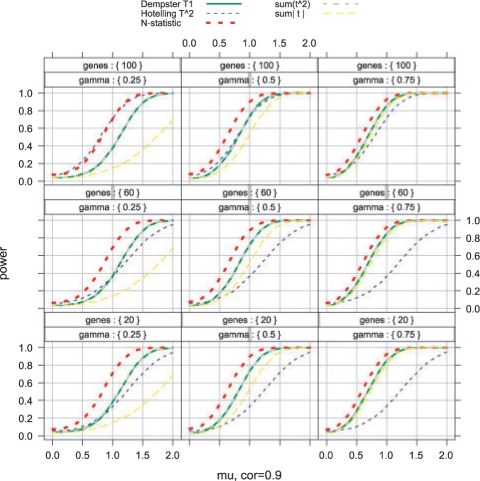
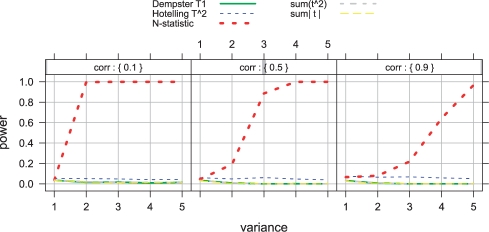
Results: In this article, we compare the performance of univariate and multivariate tests on both simulated and biological data. In the simulation study we demonstrate that high correlations equally affect the power of both, univariate as well as multivariate tests. In addition, for most of them the power is similarly affected by the dimensionality of the gene set and by the percentage of genes in the set, for which expression is changing between two phenotypes. The application of different test statistics to biological data reveals that three statistics (sum of squared t-tests, Hotelling's T(2), N-statistic), testing different null hypotheses, find some common but also some complementing differentially expressed gene sets under specific settings. This demonstrates that due to complementing null hypotheses each test projects on different aspects of the data and for the analysis of biological data it is beneficial to use all three tests simultaneously instead of focusing exclusively on just one.
Figures

References
-
- Baringhaus L, Franz C. On a new multivariate two-sample test. J. Multivariate Anal. 2004;88:190–206.
-
- Barry WT, et al. A statistical framework for testing functional categories in microarray data. Ann. Appl. Stat. 2008;2:286–315.
-
- Dempster AP. A high dimentional two sample significance test. Ann. Math. Statist. 1958;29:995–1010.
-
- Dudoit S, van der Laan MJ. Multiple Testing Procedures with Applications to Genomics. Berlin: Springer; 2008.
