. 2009 Oct;111(2):254-66.
doi: 10.1093/toxsci/kfp144. Epub 2009 Jul 2.

Dioxin increases the interaction between aryl hydrocarbon receptor and estrogen receptor alpha at human promoters

Affiliations

Dioxin increases the interaction between aryl hydrocarbon receptor and estrogen receptor alpha at human promoters

Shaimaa Ahmed et al. Toxicol Sci. 2009 Oct.

Abstract

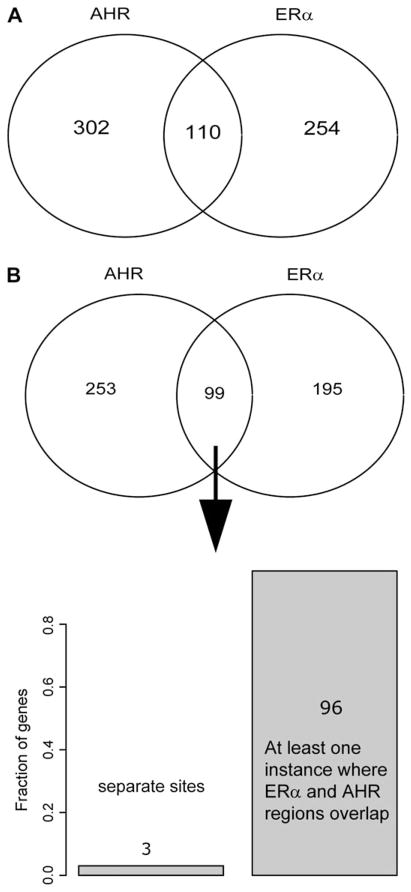
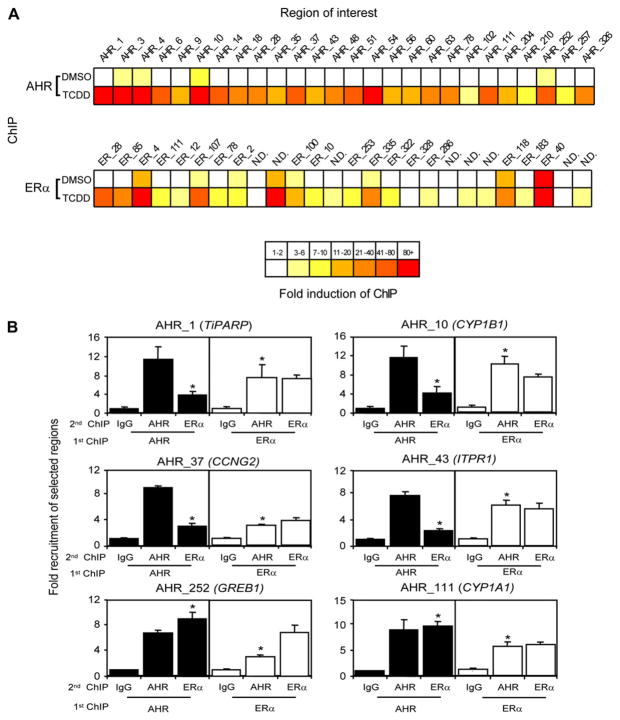
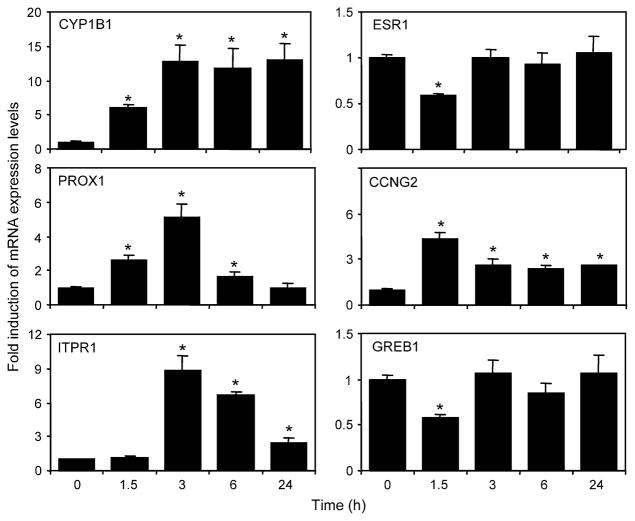
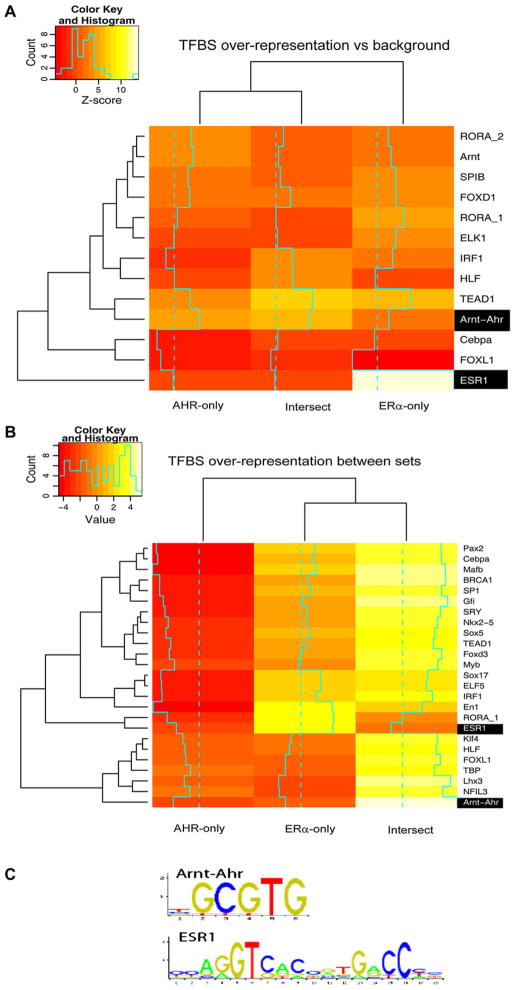
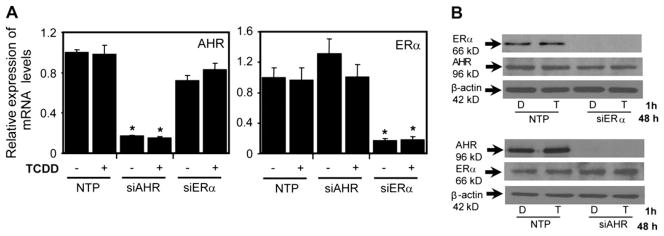
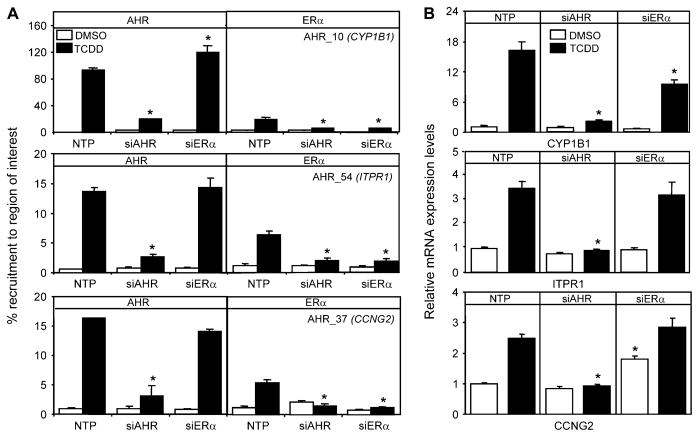
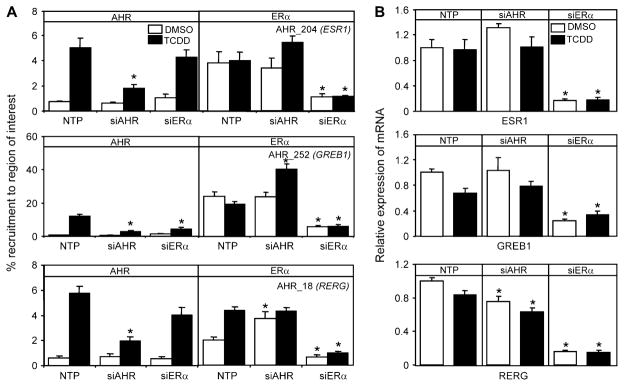
Recent studies have shown that activated aryl hydrocarbon receptor (AHR) induced the recruitment of estrogen receptor-alpha (ERalpha) to AHR-regulated genes and that AHR is recruited to ERalpha-regulated genes. However, these findings were limited to a small number of well-characterized AHR- or ERalpha-responsive genes with little knowledge of what was occurring at other genomic regions. In this study, we showed using chromatin immunoprecipitation followed by hybridization to promoter focused microarrays (ChIP-chip) that 2,3,7,8-tetrachlorodibenzo-p-dioxin treatment significantly increased the overlap of genomic regions bound by both AHR and ERalpha. Conventional and sequential ChIPs confirmed the recruitment of AHR and ERalpha to many of the identified regions. Transcription factor binding site analysis revealed an overrepresentation of aryl hydrocarbon receptor response elements in regions bound by both AHR and ERalpha, suggesting that AHR was the important factor determining the recruitment of ERalpha to these regions. RNA interference-mediated knockdown of AHR confirmed its requirement for the recruitment of ERalpha to some, but not all, of the shared regions. Our findings demonstrate not only that dioxin induces the recruitment of ERalpha to AHR target genes but also that AHR is recruited to estrogen-responsive regions in a gene-specific manner, suggesting that AHR utilizes both of these mechanisms to modulate estrogen-dependent signaling.


Figures

FIG. 1
FIG. 1
Overlap between ChIP sets and target genes. (A) Venn diagram showing the number of ChIP regions from respective experiments that overlap with more than 50% of the length of the smallest region. (B) Overlap of the experiments in terms of the identity of the closest gene. In 96 of the 99 genes where the gene has both AHR and ERα chip regions, the ChIP regions overlap physically.
FIG. 2
FIG. 2
TCDD-induced recruitment of both AHR and ERα to ChIP-chip identified regions. (A) Quantification of AHR and ERα binding was determined as fold induction above IgG DMSO and is expressed as the mean of three independent replicates. Regions were chosen to cover a range of enrichment values and included a select number of sites near AHR and ERα target genes. N.D. refers to regions that were not detected in the ERα ChIP-chip experiment. T-47D cells were treated with 10 nM TCDD for 1 h. ChIP assays were performed with the indicated antibodies, and the immunoprecipitated DNA was measured by quantitative PCR using primers targeting regions isolated in the ChIP-chip study. (B) T-47D cells were treated with 10 nM TCDD for 1 h. Sequential ChIPs were performed with the indicated antibodies. Immunoprecipitated DNA was measured by quantitative PCR using primers targeting regions isolated in the ChIP-chip study. Quantification of binding was determined as fold induction above IgG DMSO. Each error bar represents the SE of the mean of three independent replicates. Asterisks indicate statistically significant differences (p < 0.05) compared with IgG DMSO control samples.
FIG. 3
FIG. 3
Chromatin profiles correlate with expression status in TCDD-responsive genes. After TCDD treatment for the indicated time periods, RNA was isolated and reverse transcribed. mRNA expression was then determined using quantitative PCR. Data were normalized against time-matched DMSO and to ribosomal 18s levels. Each error bar represents the SE of the mean of three independent replicates. Asterisks indicate statistically significant differences (p < 0.05) compared to time-matched DMSO control samples.
FIG. 4
FIG. 4
TFBS analysis. Heat maps showing the most overrepresented and underrepresented TFBS patterns in each set, either compared to large promoter background (A) or compared between sets (B). Heat map A can be viewed as an “absolute” measure of overrepresentation, while heat map B shows what patterns that are significantly different between at least two sets in terms of occurrence. Overrepresentation or underrepresentation is expressed as a Z score, where a negative value means underrepresentation (coded red) and high values indicate overrepresentation (coded white). Z scores were translated into a color range from red to white. Rows (transcription factor binding patterns from JASPAR) and columns (ChIP regions as in Fig. 1A) are ordered by similarity to each other. Patterns having no preference to any set are not shown (see “Materials and Methods” section). The Arnt-Ahr pattern (corresponding to an AHRE) and the ESR1 pattern (corresponding to an ERE) are highlighted. (C) Sequence logo for the Arnt-Ahr and ESR1 matrices from JASPAR.
FIG. 5
FIG. 5
Analysis of AHR and ERα knockdown in T-47D cells: protein and transcript levels. (A) T-47D cells were transfected with specific siRNA against AHR and ERα for 48 h. RNA was isolated and reverse transcribed. mRNA expression was then determined using quantitative PCR. Data were normalized against time-matched DMSO and to ribosomal 18s levels. Each error bar represents the SE of the mean of three independent replicates. Significance was determined by comparison to NTP TCDD treatment p < 0.05. (B) Western blot analysis of AHR and ERα knockdown in T-47D cells following 48-h transfection then 1-h treatment with either DMSO or 10 nM TCDD. Cell extracts were probed with rabbit antibody against AHR and ERα. β-actin was used as loading control.
FIG. 6
FIG. 6
AHR is required for TCDD-dependent recruitment of ERα to a subset of co-occupied AHR and ERα target genes. (A) T-47D cells were transfected for 48 h with siRNA and then treated for 1 h with TCDD. ChIP assays were performed with the indicated antibodies, and the immunoprecipitated DNA was measured by quantitative PCR using primers targeting regions isolated in the ChIP-chip study. Quantification of binding was determined as a percent of input DNA and is expressed as the mean of three independent replicates. (B) Gene expression profiles were completed on T-47D cells transfected for 48 h with siRNA and then treated for 6 h with TCDD. RNA was isolated and reverse transcribed. mRNA expression was then determined using quantitative PCR. Data were normalized against time-matched DMSO and to ribosomal 18s levels. Each error bar represents the SE of the mean of three independent replicates. Asterisks indicate statistically significant differences (p < 0.05) compared to NTP treatment–matched samples.
FIG. 7
FIG. 7
AHR is not necessary for ERα binding to a subset of co-occupied AHR and ERα target genes. (A) T-47D cells were transfected for 48 h with siRNA and then treated for 1 h with TCDD. ChIP assays were performed with the indicated antibodies, and the immunoprecipitated DNA was measured by quantitative PCR using primers targeting regions isolated in the ChIP-chip study. Quantification of binding was determined as a percent of input DNA and is expressed as the mean of three independent replicates. (B) Gene expression profiles were completed on T-47D cells transfected for 48 h with siRNA and then treated for 6 h with TCDD. RNA was isolated and reverse transcribed. mRNA expression was then determined using quantitative PCR. Data were normalized against time-matched DMSO and to ribosomal 18s levels. Each error bar represents the SE of the mean of three independent replicates. Asterisks indicate statistically significant differences (p < 0.05) compared to NTP treatment–matched samples.

References

    1. Angus WG, Larsen MC, Jefcoate CR. Expression of CYP1A1 and CYP1B1 depends on cell-specific factors in human breast cancer cell lines: Role of estrogen receptor status. Carcinogenesis. 1999;20:947–955. - PubMed
    1. Boverhof DR, Burgoon LD, Williams KJ, Zacharewski TR. Inhibition of estrogen-mediated uterine gene expression responses by dioxin. Mol Pharmacol. 2008;73:82–93. - PubMed
    1. Bryne JC, Valen E, Tang MH, Marstrand T, Winther O, da Piedade I, Krogh A, Lenhard B, Sandelin A. JASPAR, the open access database of transcription factor-binding profiles: New content and tools in the 2008 update. Nucleic Acids Res. 2008;36:D102–D106. - PMC - PubMed
    1. Carroll JS, Liu XS, Brodsky AS, Li W, Meyer CA, Szary AJ, Eeckhoute J, Shao W, Hestermann EV, Geistlinger TR, et al. Chromosome-wide mapping of estrogen receptor binding reveals long-range regulation requiring the forkhead protein FoxA1. Cell. 2005;122:33–43. - PubMed
    1. Carroll JS, Meyer CA, Song J, Li W, Geistlinger TR, Eeckhoute J, Brodsky AS, Keeton EK, Fertuck KC, Hall GF, et al. Genome-wide analysis of estrogen receptor binding sites. Nat Genet. 2006;38:1289–1297. - PubMed

Publication types

Grants and funding