Meta-Analysis
. 2009 Aug 5;101(15):1066-82.
doi: 10.1093/jnci/djp180. Epub 2009 Jul 2.

Associations between hepatitis B virus mutations and the risk of hepatocellular carcinoma: a meta-analysis

Affiliations
Meta-Analysis

Associations between hepatitis B virus mutations and the risk of hepatocellular carcinoma: a meta-analysis

Shijian Liu et al. J Natl Cancer Inst. .

Abstract

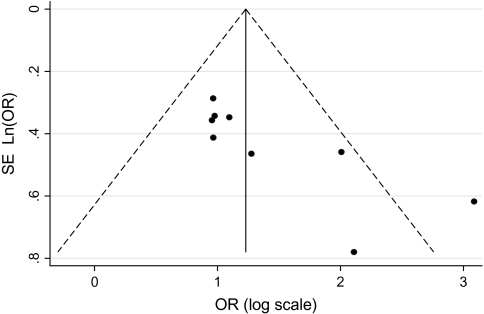
Background: The association between hepatitis B virus (HBV) mutations and hepatocarcinogenesis remains controversial because of conflicting data in the literature. We conducted a meta-analysis of case-control and cohort studies to examine HBV PreS, enhancer II (EnhII), basal core promoter (BCP), and precore mutations in relation to the risk of hepatocellular carcinoma (HCC).

Methods: We searched databases for studies of these associations that were published in English or Chinese up to August 31, 2008. HBV mutation-specific odds ratios and relative risks were pooled by use of a random-effects model and stratified by potential confounders. All statistical tests were two-sided.

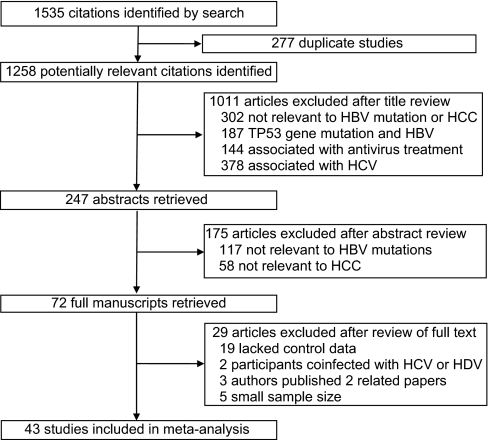
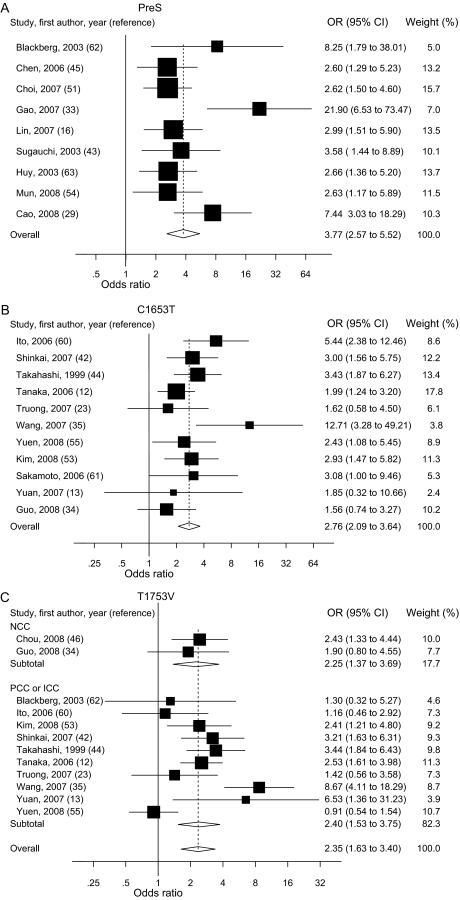
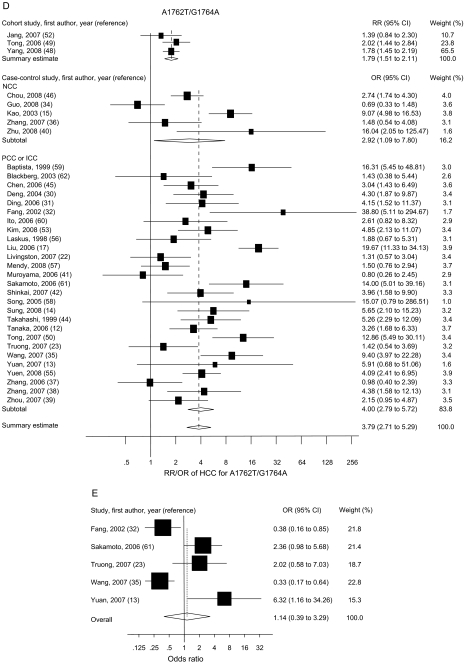
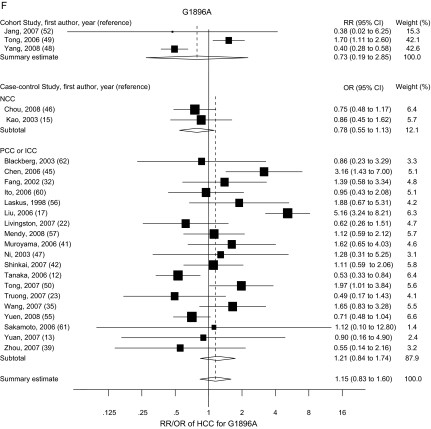
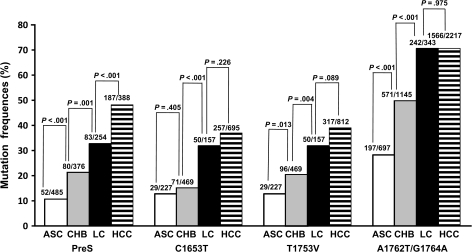
Results: Of the 43 studies included in this meta-analysis, 40 used a case-control design. The 43 studies evaluated a total of 11 582 HBV-infected participants, of whom 2801 had HCC. Statistically significant summary odds ratios of HCC were obtained for any PreS mutation (3.77, 95% confidence interval [CI] = 2.57 to 5.52), C1653T in EnhII (2.76, 95% CI = 2.09 to 3.64), T1753V (2.35, 95% CI = 1.63 to 3.40), and A1762T/G1764A in BCP (3.79, 95% CI = 2.71 to 5.29). PreS mutations were more strongly associated with an increased risk of HCC in subjects who were infected with HBV genotype C than in those who were infected with HBV genotype B, whereas the opposite was true for A1762T/G1764A. C1653T, T1753V, and A1762T/G1764A were more strongly associated with an increased risk of HCC in hepatitis B e antigen (HBeAg)-positive subjects than in HBeAg-negative subjects. PreS mutations, C1653T, T1753V, and A1762T/G1764A accumulated during the progression of chronic HBV infection from the asymptomatic carrier state to HCC (P(trend) < .001 for each mutation). PreS mutations, C1653T, C1653T + T1753V, and A1762T/G1764A-based combinations of mutations had specificities greater than 80% for the prediction of HCC. The precore mutations G1896A and C1858T were not associated with the risk of HCC, regardless of HBeAg status and HBV genotype.

Conclusions: HBV PreS mutations, C1653T, T1753V, and A1762T/G1764A are associated with an increased risk of HCC. These mutations alone and in combination may be predictive for hepatocarcinogenesis.


Figures

Figure 1
Figure 1
Flow chart of article selection. HBV = hepatitis B virus; HCC = hepatocellular carcinoma; HCV = hepatitis C virus; HDV = hepatitis D virus.
Figure 2
Figure 2
Summary odds ratios (ORs; in case–control studies) or relative risks (RRs; in cohort studies) of hepatocellular carcinoma (HCC) for PreS (A), C1653T (B), T1753V (C), A1762T/G1764A (D), C1858T (E), and G1896A (F) mutations. Squares represent study-specific estimates (size of the square reflects the study-specific statistical weight); horizontal lines represent 95% confidence intervals (CIs); diamonds represent summary estimates with corresponding 95% CIs. Test for heterogeneity: (A) P = .045, I2 = 49.3%; (B) P = .197, I2 = 25.9%; (C) P < .001, I2 = 66.3%; (D) P < .001, I2 = 76.4%; (E) P < .001, I2 = 83.2%; (F) P < .001, I2 = 80.0%. A random-effects model was used for all analyses. All statistical tests were two-sided. NCC = nested case–control; PCC = prevalence case–control; ICC = incidence case–control.
Figure 2
Figure 2
Summary odds ratios (ORs; in case–control studies) or relative risks (RRs; in cohort studies) of hepatocellular carcinoma (HCC) for PreS (A), C1653T (B), T1753V (C), A1762T/G1764A (D), C1858T (E), and G1896A (F) mutations. Squares represent study-specific estimates (size of the square reflects the study-specific statistical weight); horizontal lines represent 95% confidence intervals (CIs); diamonds represent summary estimates with corresponding 95% CIs. Test for heterogeneity: (A) P = .045, I2 = 49.3%; (B) P = .197, I2 = 25.9%; (C) P < .001, I2 = 66.3%; (D) P < .001, I2 = 76.4%; (E) P < .001, I2 = 83.2%; (F) P < .001, I2 = 80.0%. A random-effects model was used for all analyses. All statistical tests were two-sided. NCC = nested case–control; PCC = prevalence case–control; ICC = incidence case–control.
Figure 3
Figure 3
Funnel plot of the logarithm of the odds ratio (OR) for PreS mutation vs no PreS mutation, and the SE of natural logarithm of the ORs for the included studies that examined PreS mutations. The dashed line represents 95% confidence intervals. Circles represent individual studies.
Figure 4
Figure 4
Frequencies of PreS, C1653T, T1753V, or A1762T/G1764A mutations among asymptomatic hepatitis B surface antigen carriers (ASC), patients with chronic hepatitis B (CHB), patients with liver cirrhosis (LC), and patients with hepatocellular carcinoma (HCC) from the pooled data. P values (two-sided) are from the χ2 test. Absolute numbers of the participants with hepatitis B virus mutation data are shown on the top of each column. The numerators represent the number of the patients (participants) with the mutation(s). The denominators represent subtotal number of the patients (participants) with and without the mutation(s).

References

    1. El-Serag HB, Rudolph KL. Hepatocellular carcinoma: epidemiology and molecular carcinogenesis. Gastroenterology. 2007;132(7):2557–2576. - PubMed
    1. Yu MC, Yuan JM, Govindarajan S, Ross RK. Epidemiology of hepatocellular carcinoma. Can J Gastroenterol. 2000;14(8):703–709. - PubMed
    1. Kay A, Zoulim F. Hepatitis B virus genetic variability and evolution. Virus Res. 2007;127(2):164–176. - PubMed
    1. Yim HJ, Lok AS. Natural history of chronic hepatitis B virus infection: what we knew in 1981 and what we know in 2005. Hepatology. 2006;43(2)(suppl 1):S173–S181. - PubMed
    1. Chen CJ, Yang HI, Su J, et al. Risk of hepatocellular carcinoma across a biological gradient of serum hepatitis B virus DNA level. JAMA. 2006;295(1):65–73. - PubMed

Publication types

MeSH terms