

Mechanistic details of BK channel inhibition by the intermediate conductance, Ca2+-activated K channel
- PMID: 19574736
- PMCID: PMC3292429
- DOI: 10.4161/chan.3.3.9043
Mechanistic details of BK channel inhibition by the intermediate conductance, Ca2+-activated K channel
Abstract
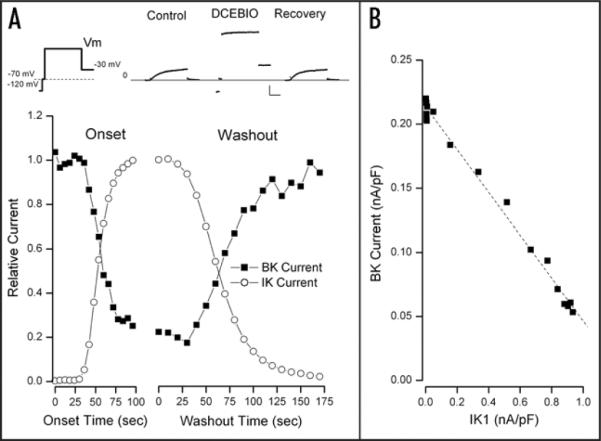
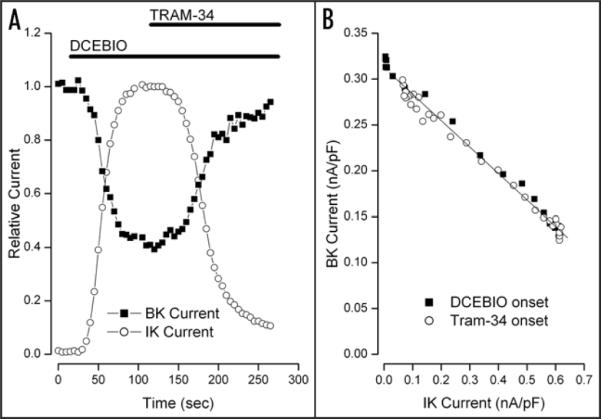
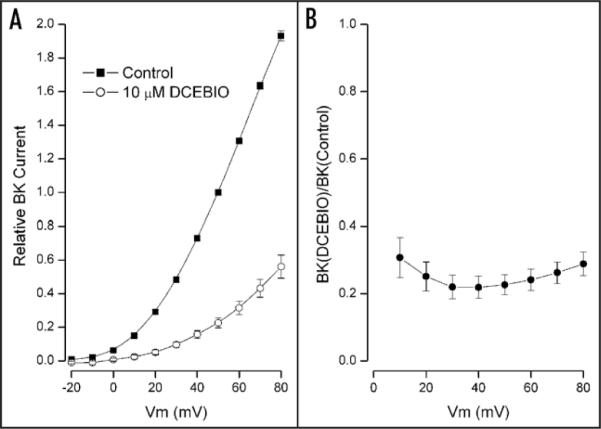
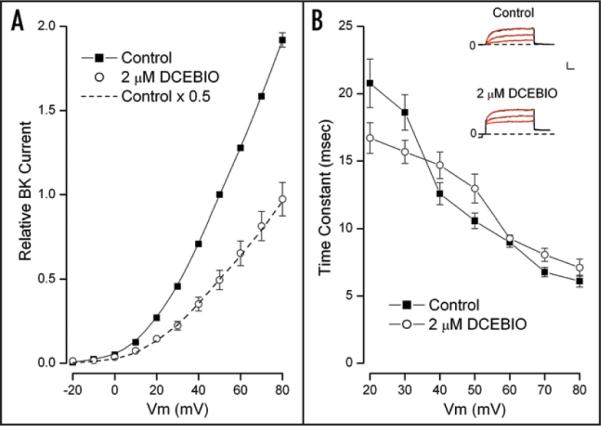
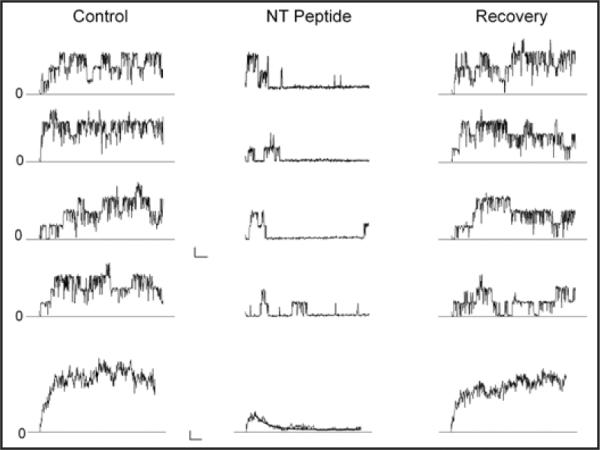
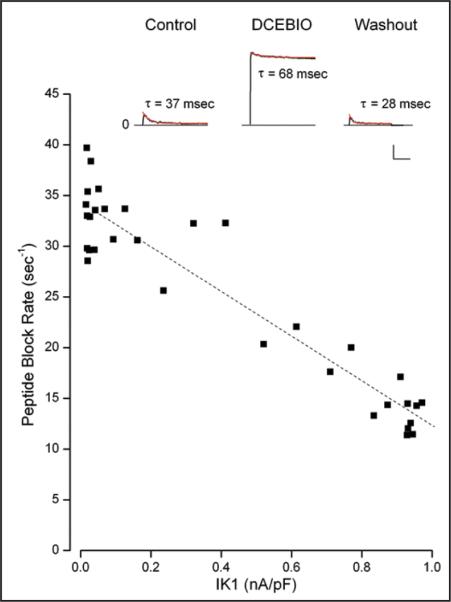
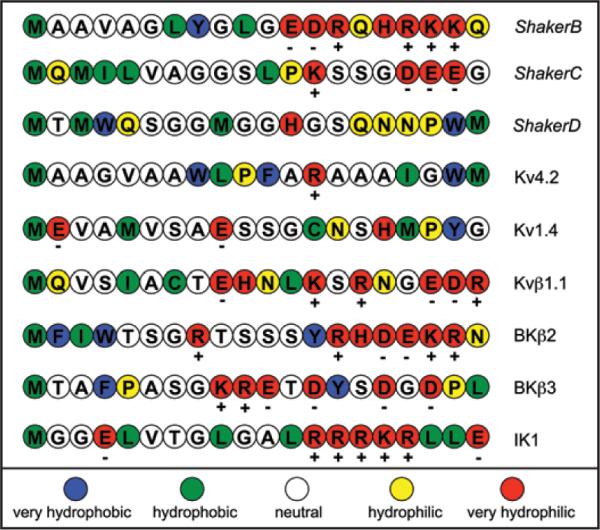
Salivary gland acinar cells have two types of Ca(2+)-activated K channels required for fluid secretion: the intermediate conductance (IK1) channel and the large conductance (BK) channel. Activation of IK1 inhibits BK channels including in small, cell-free, excised membrane patches. As a first step toward understanding the mechanism underlying this interaction, we examined its voltage sensitivity. We found that the IK1-induced inhibition of BK channels was only weakly voltage dependent and not accompanied by alteration in BK gating kinetics. These actions of IK1 on BK channels are not consistent with a mechanism whereby activation of IK1 causes a shift of the BK channel's voltage dependence as occurs for many BK modulatory processes. In a search for other clues about the interaction mechanism, we noted that the N-terminus of the IK1 channel shares some chemical features with the N-terminal regions of two BK subunits known to inhibit BK activity by blocking the cytoplasmic end of the BK pore. Thus, we tested the idea that the N-terminus of IK1 channels may act similarly. We found that a peptide derived from the N-terminal region of the IK1 protein blocked BK channels. Significantly, we also found that the activation of IK1 channels competed with block by the N-terminus peptide. Thus, the activation of IK1 channels inhibits BK channels by a mechanism that involves block of the cytoplasmic pore, not an alteration in the voltage dependence of BK gating. The mediator of this cytoplasmic pore block may be the IK1 N-terminus.
Figures

Similar articles
-
Ca2+-activated K channels in parotid acinar cells: The functional basis for the hyperpolarized activation of BK channels.Channels (Austin). 2010 Jul-Aug;4(4):278-88. doi: 10.4161/chan.4.4.12197. Epub 2010 Jul 28. Channels (Austin). 2010. PMID: 20519930 Free PMC article.
-
Selectivity filter gating in large-conductance Ca(2+)-activated K+ channels.J Gen Physiol. 2012 Mar;139(3):235-44. doi: 10.1085/jgp.201110748. J Gen Physiol. 2012. PMID: 22371364 Free PMC article.
-
Membrane-delimited inhibition of maxi-K channel activity by the intermediate conductance Ca2+-activated K channel.J Gen Physiol. 2006 Feb;127(2):159-69. doi: 10.1085/jgp.200509457. Epub 2006 Jan 17. J Gen Physiol. 2006. PMID: 16418402 Free PMC article.
-
Large conductance Ca2+-activated K+ (BK) channel: activation by Ca2+ and voltage.Biol Res. 2006;39(3):385-401. doi: 10.4067/s0716-97602006000300003. Epub 2006 Nov 7. Biol Res. 2006. PMID: 17106573 Review.
-
Allosteric interactions and the modular nature of the voltage- and Ca2+-activated (BK) channel.J Physiol. 2010 Sep 1;588(Pt 17):3141-8. doi: 10.1113/jphysiol.2010.191999. Epub 2010 Jul 5. J Physiol. 2010. PMID: 20603335 Free PMC article. Review.
Cited by
-
Ca²⁺-dependent K⁺ channels in exocrine salivary glands.Cell Calcium. 2014 Jun;55(6):362-8. doi: 10.1016/j.ceca.2014.01.005. Epub 2014 Jan 31. Cell Calcium. 2014. PMID: 24559652 Free PMC article. Review.
-
Bisphenol A activates BK channels through effects on α and β1 subunits.Channels (Austin). 2014;8(3):249-57. doi: 10.4161/chan.27709. Channels (Austin). 2014. PMID: 24476761 Free PMC article.
-
Investigating CFTR and KCa3.1 Protein/Protein Interactions.PLoS One. 2016 Apr 19;11(4):e0153665. doi: 10.1371/journal.pone.0153665. eCollection 2016. PLoS One. 2016. PMID: 27092946 Free PMC article.
-
Regulation of Ca²⁺ release through inositol 1,4,5-trisphosphate receptors by adenine nucleotides in parotid acinar cells.Am J Physiol Gastrointest Liver Physiol. 2012 Jan 1;302(1):G97-G104. doi: 10.1152/ajpgi.00328.2011. Epub 2011 Sep 29. Am J Physiol Gastrointest Liver Physiol. 2012. PMID: 21960523 Free PMC article.
-
Apical Ca2+-activated potassium channels in mouse parotid acinar cells.J Gen Physiol. 2012 Feb;139(2):121-33. doi: 10.1085/jgp.201110718. J Gen Physiol. 2012. PMID: 22291145 Free PMC article.
References
-
- Hille B. Ion Channels of Excitable Membranes. Sinauer Associates, Inc; Sunderland, Mass: 2001.
-
- Khanna R, Chang MC, Joiner WJ, Kaczmarek LK, Schlichter LC. hSK4/hIK1, a calmodulin-binding KCa channel in human T lymphocytes. Roles in proliferation and volume regulation. J Biol Chem. 1999;274:14838–49. - PubMed
-
- Vandorpe DH, Shmukler BE, Jiang L, Lim B, Maylie J, Adelman JP, et al. cDNA cloning and functional characterization of the mouse Ca2+-gated K+ channel, mIK1. Roles in regulatory volume decrease and erythroid differentiation. J Biol Chem. 1998;273:21542–53. - PubMed
-
- Begenisich T, Nakamoto T, Ovitt CE, Nehrke K, Brugnara C, Alper SL, et al. Physiological roles of the intermediate conductance, Ca2+-activated potassium channel Kcnn4. J Biol Chem. 2004;279:47681–7. - PubMed
Publication types
MeSH terms
Substances
Grants and funding
LinkOut - more resources
Full Text Sources
Research Materials
Miscellaneous