Review
. 2009:25:301-27.
doi: 10.1146/annurev.cellbio.042308.113408.

Quantitative time-lapse fluorescence microscopy in single cells

Affiliations
Review

Quantitative time-lapse fluorescence microscopy in single cells

Dale Muzzey et al. Annu Rev Cell Dev Biol. 2009.

Abstract

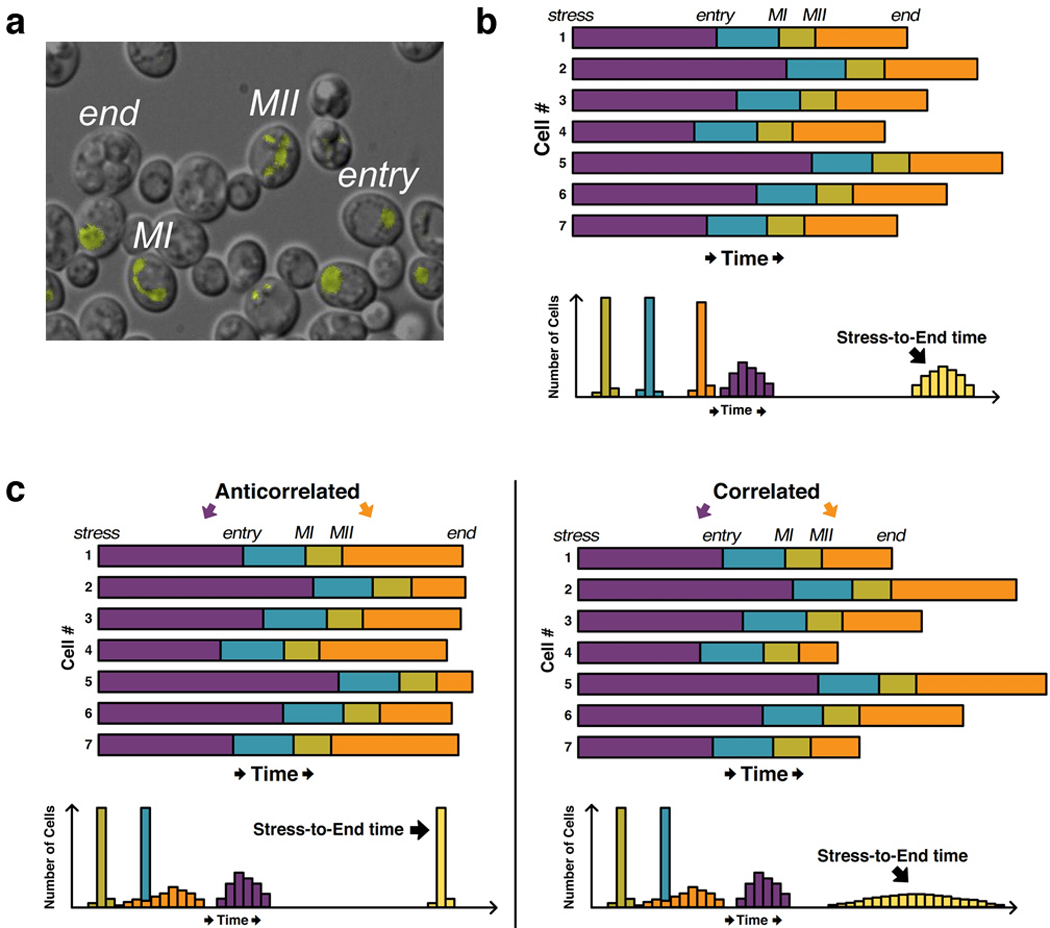
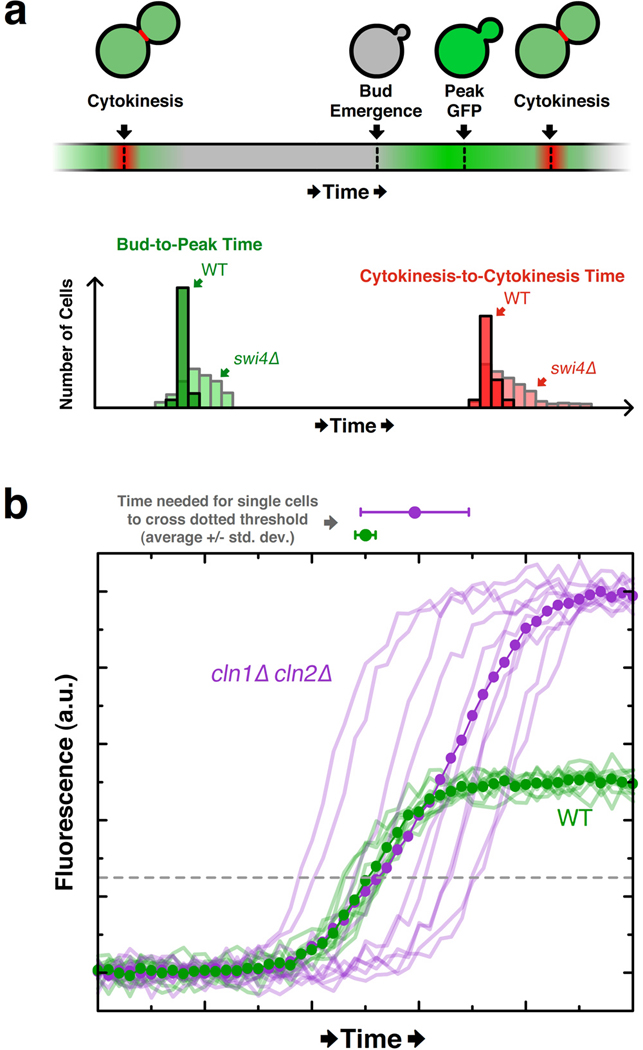
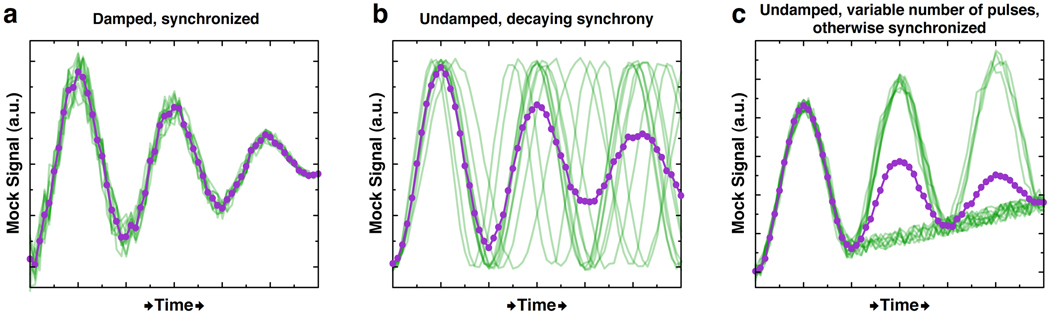
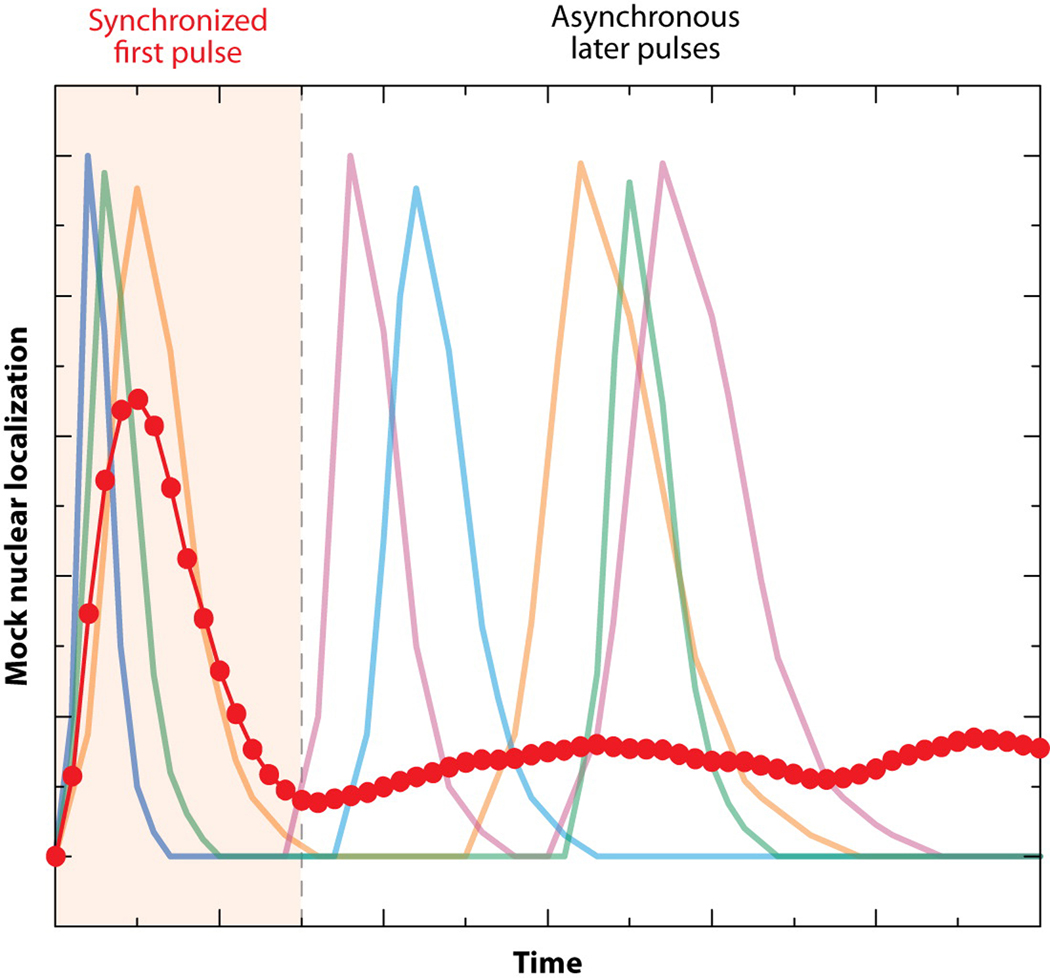
The cloning of green fluorescent protein (GFP) 15 years ago revolutionized cell biology by permitting visualization of a wide range of molecular mechanisms within living cells. Though initially used to make largely qualitative assessments of protein levels and localizations, fluorescence microscopy has since evolved to become highly quantitative and high-throughput. Computational image analysis has catalyzed this evolution, enabling rapid and automated processing of large datasets. Here, we review studies that combine time-lapse fluorescence microscopy and automated image analysis to investigate dynamic events at the single-cell level. We highlight examples where single-cell analysis provides unique mechanistic insights into cellular processes that cannot be otherwise resolved in bulk assays. Additionally, we discuss studies where quantitative microscopy facilitates the assembly of detailed 4D lineages in developing organisms. Finally, we describe recent advances in imaging technology, focusing especially on platforms that allow the simultaneous perturbation and quantitative monitoring of biological systems.


Figures

Figure 1
Figure 1
Cell-to-cell variability in the timing of meiotic events. (a) Meiotic regulator Dmc1 was fused to YFP and visualized in live budding yeast cells. Since Dmc1 associates with chromosomes, the stage of meiotic progression (e.g., entry, MI, MII, end) could be tracked using image-analysis software that effectively detects the number of Dmc1-YFP foci (e.g., entry has one focus, MI has two, and MII has four). (b) Top: Hypothetical data for seven single cells based on the results in Nachman et al., where the length of the shaded bars corresponds to the amount of time spent in each stage. Nutritional stress was applied to all cells at the same time, hence their alignment at the “stress” marker on the left. Bottom: Hypothetical histograms reflecting the time spent in each stage across many cells. Note that variability in the total time (i.e., “stress-to-end time”) is dominated by the stress-to-entry time and not by variability in the duration of other stages, as observed by Nachman et al. (c) Left: Hypothetical single-cell profiles (top) and histograms (bottom) illustrating how anticorrelation between the stress-to-entry time and the MII-to-end time lead to a reduction in stress-to-end variability as compared to (b). Right: Correlation between stress-to-entry and MII-to-end times leads to more variability in the stress-to-end time than in (b). Panel (a) reproduced from Reference (Nachman et al 2007) with permission of Cell.
Figure 2
Figure 2
Variability in the timing of mitotic cell-cycle events and positive feedback revealed by single-cell traces. (a) Top: Schematic of single-cell events tracked via image analysis software in investigation of budding-yeast Start checkpoint. The timing of cytokinesis was determined by the rapid disappearance of the Cdc10-GFP fusion protein (here shown in red) from the bud neck. The green signal corresponds to expression of GFP under the control of the CLN2 promoter (“CLN2-GFP”). Bottom: Hypothetical histograms based on findings of Bean et al. in which swi4Δ cells exhibit considerably higher variability in the timing both between bud emergence and peak CLN2-GFP signal, and between successive cytokinesis events. (b) Hypothetical single-cell data (faded lines) illustrating how bulk measurements (dotted opaque line) mask the observation that CLN2-GFP is expressed earlier in wildtype cells than in cln1Δcln2Δ cells, as shown in Skotheim et al. The average traces overlap for much of the trajectory and give no indication that wildtype cells express CLN2-GFP earlier than mutant cells. However, the average time at which single-cell CLN2-GFP levels cross an arbitrary threshold (dashed line) is notably different between the cell lines (see dots and error boundaries above the plot).
Figure 3
Figure 3
Damped oscillations observed in bulk measurements can result from fundamentally different behaviors at the single-cell level. In (a), (b), and (c), all data is hypothetical; the mean is shown in purple, and single-cell traces are light green. (a) Single cells behave like the mean and undergo synchronized, damped oscillations. (b) Single cells are initially synchronized, but their synchrony decays with time. (c) Cells exhibit a discrete number of undamped and synchronized signal pulses, but the number of cells pulsing diminishes with time, consistent with the observations in Lahav et al. of p35 expression. A baseline increase to the mock signal is added in (c) such that the mean trace resembles those in (a) and (b).
Figure 4
Figure 4
One synchronized pulse followed by a series of unsynchronized pulses yields an average trajectory (dotted-blue line) that fails to represent single-cell activity (faded colored lines). Mock data is shown only for four hypothetical single cells, but the average trace was calculated from a simulation of 100 single cells. This schematic resembles the data of Cai et al., who quantified activity of Crz1-GFP by using image-analysis software to measure its nuclear enrichment in single cells.
Figure 5
Figure 5
The composition of processing factors in single cisternae of the Golgi apparatus changes rapidly. (a) The early processing factor Vrg4 was tagged with GFP, and the late processing factor Sec7 was tagged with DsRed; the localization of each signal was measured dynamically (Losev et al). Image-analysis software was used to track individual cisternae. Top: One cisterna, marked by the white arrow, is followed over time as it transitions from green to red. Times shown at bottom-left of each image are in mm:ss. Bottom: Same as top, except fluorescence channels are only shown for the cisterna marked with an arrow in top. (b) Quantification of the signal in (a), indicating that the early processing factor vacates the cisterna around the time the late processing factor enters. Note that the time between entry of early factors and exit of late factors is ~7 minutes, close to the time needed for secreted proteins to undergo processing in the Golgi. Figure reproduced from Reference (Losev et al 2006) with permission of Nature.
Figure 6
Figure 6
Sequential assembly of components into the nuclear-pore complex (NPC) tracked with high-temporal resolution. The thin black curve represents the nuclear localization of IBB-DiHcRed, a fusion protein imported following cell division via the NPC, and the time 0 min (i.e., “t1/2(import)”) is set when the black curve reaches half its maximal level. The relative rates of nuclear localization of GFP-tagged nucleoporins (“Nups”) and IBB-DiHcRed in strains bearing only one GFP-tagged Nup were used to determine the relative incorporation times of 11 different Nups. Figure reproduced from Reference (Dultz et al 2008) with permission of Journal of Cell Biology.
Figure 7
Figure 7
In the absence of bud-site landmarks, the polar cap of active Cdc42 wanders around the cell periphery. The CRIB domain of Gic2, which binds specifically to active Cdc42, was tagged with GFP and monitored in wildtype cells and in mutant cells lacking Rsr1 (a.k.a. “Bud1”). Rsr1 marks the site of budding, and active Cdc42 recruits factors that mediate the budding process. In rsr1Δ cells, bud formation still occurs but at a random location. These time-lapse images (where the number at upper-left is the number of minutes) indicate that the polar cap of active Cdc42 rapidly traverses the cell periphery instead of randomly picking one location and remaining fixed there. Figure reproduced from Reference (Ozbudak et al 2005) with permission of Developmental Cell.
Figure 8
Figure 8
Correlated switching times among closely related single cells revealed via simultaneous monitoring of lineage and gene expression. (a) YFP expressed under control of the GAL1 promoter (GAL1-YFP) is shown in purple. Genealogy is indicated by the numbering scheme in which hyphens separate generations (e.g., 1-1-1 is the daughter of 1-1 and the granddaughter of 1), and the number indicates siblings (e.g., 1–2 is the sister of 1-1 and the second daughter of 1). Although all cells in the rightmost panel are close relatives of cell 1, only a subset expresses GAL1-YFP. (b) Quantification of GAL1-YFP expression in a mother and daughter shows that both switch to an expressing state nearly simultaneously. It was shown that related cells separated by up to four generations tended to activate GAL1-YFP expression at a similar time. Figure reproduced from Reference (Kaufmann et al 2007) with permission of PLoS Biology.
Figure 9
Figure 9
Lineage comparison reveals developmental similarities between C. elegans (a) and C. briggsae (b) embryos. Spots represent nuclei, which were visualized via GFP-labeled histones and tracked computationally in 3D over time. Color-coding indicates descendants of a common precursor cell. Figure reproduced from Reference (Zhao et al 2008) with permission of Developmental Biology.
Figure 10
Figure 10
Orientation of microtubule bundles in A. thaliana corresponds highly with predictions from model of cell-wall stress. (a) The microtubule-binding domain of a microtuble-associated protein was tagged with GFP. GFP signal above a high threshold signified cell boundaries (pseudocolored red), and signal below the threshold indicated cell-traversing microtubules (pseudocolored green). The letter P indicates the position of a developing primordium, a position characterized by rapid cell growth and a lack of alignment in microtubule orientation. To the upper-left of the primordium is a region where microtubules are tightly aligned in the southwest-to-northeast direction. Scale bar = 20 µm. (b) A model that predicts stress across the cell wall can also accurately predict microtubule orientations (red). Inputs to the model include the 3D tissue shape and cell boundaries from (a). Note the consistency between the model’s predictions and actual microtubule orientations from (a) in the region to the upper-left of P. Figure reproduced from Reference (Hamant et al 2008) with permission of Science.
Figure 11
Figure 11
Development of the zebrafish embryo imaged using GFP-labeled histones. (a) Positions and velocities of nuclei represented at three time points. At each time point, a 3D image is generated by acquiring a stack of 2D images (x and y dimensions) across a range of z positions. In the black-and-white images at left, the maximum intensity across the whole z-stack for every pixel in x,y space is plotted. Shading in the colored images at right indicates the velocities (cyan = slow; orange = fast) of single nuclei as determined by their relative position in adjacent frames. Scale bar = 100µm. (b) Individual nuclei from 280-minute sample in (a) can be imaged at very high resolution. Scale bar = 10µm. Figure reproduced from Reference (Keller et al 2008) with permission from Science.
Figure 12
Figure 12
Illustration of bandwidth as a measure of pathway responsiveness. (a) In both Hersen et al. and Mettetal et al., a microfluidic device delivered pulses of media with differing osmolyte concentrations (“Input” panel) to yeast cells, causing the activation and nuclear enrichment of the fluorescently tagged MAP kinase Hog1 (“Output” panel). Below the bandwidth frequency, the output tracks the input signal. (b) For input frequencies above the bandwidth, however, the cells cannot reliably process the input, leading to an “Effective Input” shown schematically in blue, which is approximately the integral of the input. The output very poorly represents the fluctuations in the input signal.
Figure 13
Figure 13
Fluorescence imaging below the diffraction limit highlights features occluded even using confocal microscopy. (a) A yellow fluorescent protein fused to a sequence that targeted it to the endoplasmic reticulum was imaged using confocal microscopy (left) and stimulated emission depletion (STED, right). Arrows indicate positions where STED detects a ring in the ER structure not visible by confocal imaging. Scale bar = 1µm. (b) Comparison of immunofluorescence staining of microtubules using confocal microscopy (top) and stochastic optical reconstruction microscopy (STORM, bottom). The middle and rightmost panels are zoomed portrayals of the dotted boxes in the upper-left panel. The pixelation of these zoomed panels is apparent in the confocal images but not STORM, since STORM imaging can identify fluorophore positioning with considerably higher spatial resolution as compared to confocal imaging. Part (a) of figure reproduced from Reference (Hein et al 2008) with permission of PNAS, and part (b) reproduced from Reference (Bates et al 2007) with permission of Science.

Similar articles

Cited by

References

    1. Ai HW, Shaner NC, Cheng Z, Tsien RY, Campbell RE. Exploration of new chromophore structures leads to the identification of improved blue fluorescent proteins. Biochemistry. 2007;46:5904–5910. - PubMed
    1. Ando R, Mizuno H, Miyawaki A. Regulated fast nucleocytoplasmic shuttling observed by reversible protein highlighting. Science. 2004;306:1370–1373. - PubMed
    1. Balagaddé FK, You L, Hansen CL, Arnold FH, Quake SR. Long-term monitoring of bacteria undergoing programmed population control in a microchemostat. Science. 2005;309:137–140. - PubMed
    1. Bao Z, Murray JI, Boyle T, Ooi SL, Sandel MJ, Waterston RH. Automated cell lineage tracing in Caenorhabditis elegans. Proc Natl Acad Sci USA. 2006;103:2707–2712. - PMC - PubMed
    1. Bates M, Huang B, Dempsey GT, Zhuang X. Multicolor super-resolution imaging with photo-switchable fluorescent probes. Science. 2007;317:1749–1753. - PMC - PubMed

Publication types

Substances

LinkOut - more resources