

Review
doi: 10.1146/annurev.cellbio.042308.113344.
Vertebrate endoderm development and organ formation
Affiliations
- PMID: 19575677
- PMCID: PMC2861293
- DOI: 10.1146/annurev.cellbio.042308.113344
Item in Clipboard
Review
Vertebrate endoderm development and organ formation
Annu Rev Cell Dev Biol.
2009.
Abstract
The endoderm germ layer contributes to the respiratory and gastrointestinal tracts and to all of their associated organs. Over the past decade, studies in vertebrate model organisms, including frog, fish, chick, and mouse, have greatly enhanced our understanding of the molecular basis of endoderm organ development. We review this progress with a focus on early stages of endoderm organogenesis including endoderm formation, gut tube morphogenesis and patterning, and organ specification. Lastly, we discuss how developmental mechanisms that regulate endoderm organogenesis are used to direct differentiation of embryonic stem cells into specific adult cell types, which function to alleviate disease symptoms in animal models.
Figures
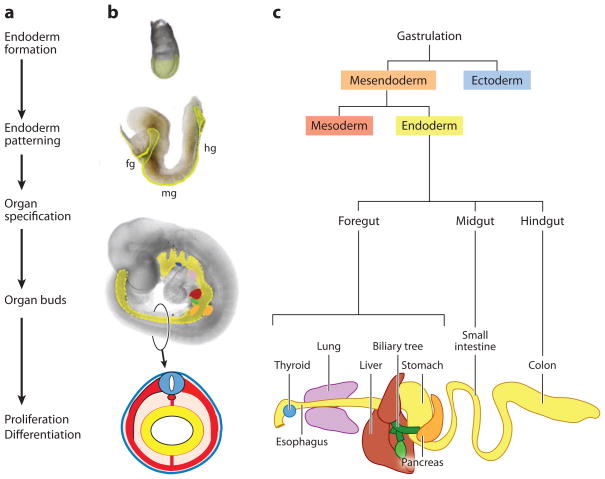
Overview and timeline of endoderm organ formation. (a) The major events in endoderm organ formation are listed in chronological order and (b) illustrated with images of mouse embryos at e7.5 (top), e8.5, and e9.5 of development, with the endoderm shaded in (yellow). A schematic of a cross section through the e9.5 embryo illustrates the characteristic arrangement of the germ layers with the endoderm lining the gut tube (yellow), surrounded by mesoderm (red), and ectoderm (blue). (c) Endoderm cell lineages projected on to a schematic of the gastrointestinal tract. Fg; foregut, mg; midgut and hg; hindgut. The mouse embryo images are modified with permission from Zorn (2008).
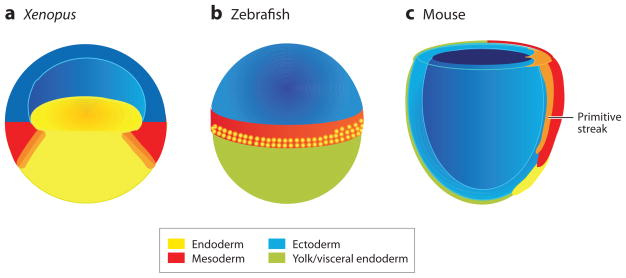
Fate maps of (a) a Xenopus blastula, (b) a zebrafish blastula, and (c) an early streak-stage mouse gastrula, showing the presumptive endoderm (yellow), mesoderm (red) and ectoderm (blue). (a) The Xenopus blastula is depicted in section through the middle of the embryo to expose the bastocoel cavity, the putative mesendoderm (orange) at the border between the yolky vegetal endoderm cells, and the ring of equatorial mesoderm. The Xenopus blastula ectoderm is often referred to as the animal cap. (b) The external surface of a zebrafish blastula just prior to gastrulation is shown with the epiblast (also known as the blastoderm) sitting on top of the large yolk cell (green). The endoderm precursor cells are located in the 2–4 rows of marginal cells that are closest to the yolk (with proportionally more on the future dorsal—right side); and these are interspersed with mesoderm precursors that are found up to 8-cell rows from the margin. (c) The cut-away view of an early streak-stage mouse gastrula shows the definitive endoderm (yellow) emerging from the anterior end of the primitive streak (orange) and displacing the visceral endoderm (green). It is unclear if a transient mesendoderm progenitor resides within the primitive streak (orange).
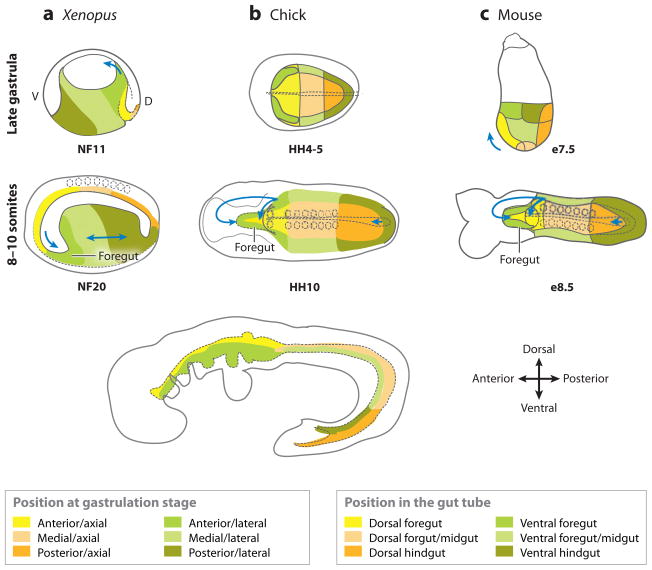
Fate maps of (a) Xenopus, (b) chick, and (c) mouse embryos from the late gastrula to the early-somite stage. The (top panels) that show late-gastrula stage in the Xenopus (NF11) and mouse (e7.5) are a lateral view; and the chick (HH4) is a ventral view. The (dotted line) in the chick shows the developing notochord. The colored domains roughly correspond to the fate-map studies. The Xenopus embryos are depicted in mid-saggital section. The (middle panels) are a ventral view of 8–10 somite stage embryos. The (arrows) indicate the folding/migration direction of the foregut and hindgut; the (dotted circles) are somites; the (dotted line) along the midline is the notochord; and the (dotted line) in the anterior outlines the developing foregut. The (bottom panel) is a schematic showing a lateral view of an E9.5 mouse embryo. The colored domains shown at the bottom indicate the domains of the gastrula-stage embryos that roughly correspond with the equivalent domains of the gut tube. A, anterior; P, posterior; d, dorsal; v, ventral.
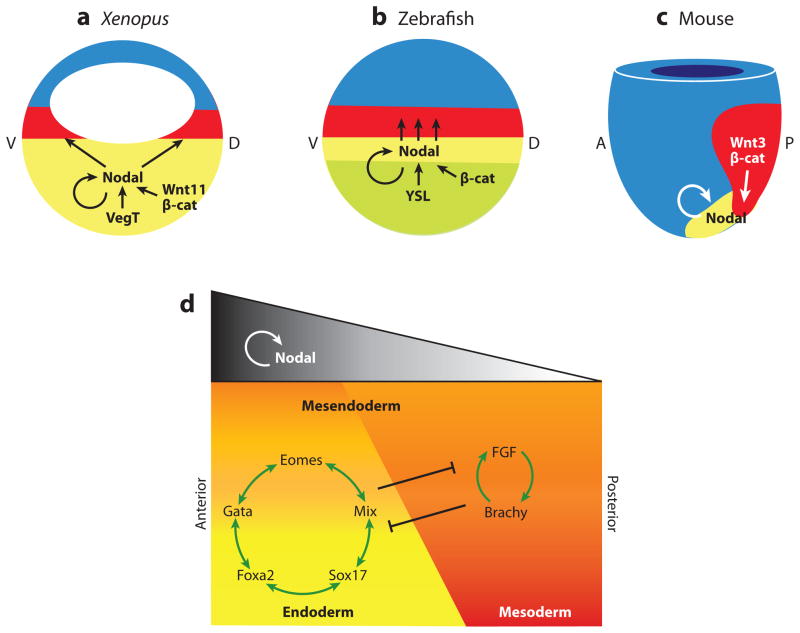
Nodal signaling in mesendoderm induction. Fate maps of (a) Xenopus and (b) zebrafish blastula, and (c) an early mouse gastrula showing the endoderm (yellow), mesoderm (red), and ectoderm (blue), and the molecular pathways regulating Nodal gene expression and signaling in each species. (a) In Xenopus, Nodal transcription in the endoderm is activated by the maternal T-box transcription factor VegT, in cooperation with Wnt11/β-catenin on the future dorsal (d) side of the embryo. In zebrafish, an unknown signaling from the YSL induces Nodal transcription in the marginal mesendoderm in cooperation with maternal dorsal β-catenin. In both Xenopus and zebrafish, Nodal autoregulation maintains its own expression in the endoderm, and Nodal diffuses to induce mesoderm in the adjacent tissue. (c) In the mouse, high levels of Nodal expression in the node and primitive streak maintain Nodal autoregulation as well as Wnt3/β-catenin signaling. d, dorsal; v, ventral; a, anterior; p, posterior. (d) The schematic depicts a generalized model, incorporating data from frog, fish, and mouse; which shows endoderm and mesoderm induction by different levels of Nodal signaling; and how the downstream transcription factors might segregate these lineages from a common mesendoderm progenitor. High levels of Nodal are required to induce endoderm and anterior mesendoderm, whereas lower levels are sufficient for mesoderm and posterior tissue.
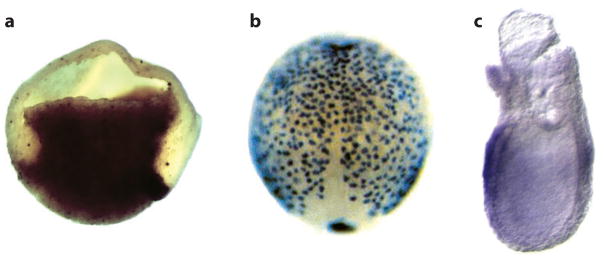
In situ hybridization showing Sox17 expression in gastrula stage (a) Xenopus, (b) zebrafish, and (c) mouse embryos. (a) The Xenopus embryo is bisected with dorsal to the right. (b) The dorsal side of the zebrafish embryo is shown with anterior up, illustrating the dispersed layer of endoderm cells spread over the embryo. (c) A lateral view of the mouse embryo (posterior to the right) shows Sox17 expression in the endoderm layer surrounding the embryo. Reproduced with permission from Zorn and Wells (2007).
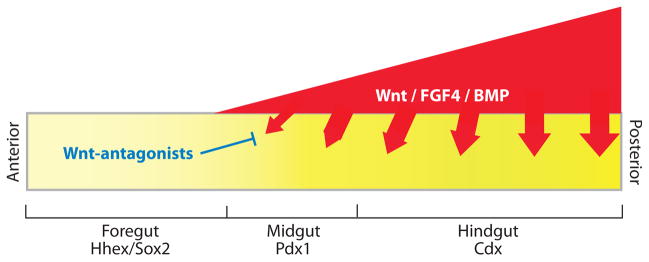
A model of early A-P patterning, incorporating recent data from frog, fish, mouse, and chick. During gastrulation and early somite stages of development, differential Wnt, FGF4, and BMP signaling along the A-P axis patterns the naïve endoderm into foregut, midgut, and hindgut progenitor domains; which express the transcription factors Hhex, Pdx1, and Cdx, respectively. Although this model remains to be validated genetically in the mouse, the available data suggests that Wnt, FGF, and BMP ligands; which are expressed in a graded fashion in the mesoderm (red); signal to the adjacent endoderm (yellow) to repress foregut identity and promote hindgut fate. Secreted Wnt-antagonists, such as Sfrp5 in the anterior endoderm, inhibit Wnt ligands to maintain foregut identity and proper foregut morphogenesis. Modified with permission from Zorn (2008).
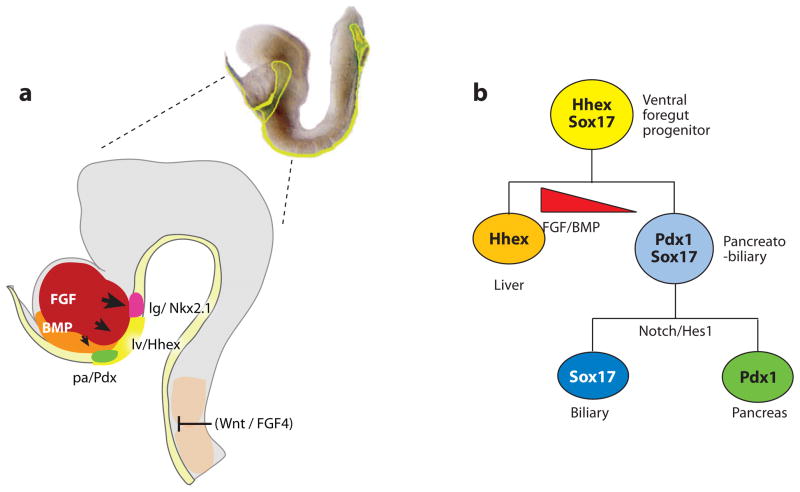
Foregut organ induction. (a) A lateral view of the anterior portion of an e8.25 (2–4 somite stage) mouse embryo (right). The developing head is shown in (gray). At this stage, the definitive endoderm (yellow) is forming a foregut pocket. The liver (lv) is marked by Hhex expression and is induced a portion of the ventral foregut by FGF signals from the cardiogenic mesoderm (red), and BMPs from the septum transversum mesenchyme (orange). The presumptive lung (lg) (red) and pancreas (pa) (green) are marked by Nkx2.1 and Pdx1 respectively. Signals from the axial mesoderm (candidates include FGF4 and Wnt ligands) repress hepatic fate in the dorsal endoderm. (b) Lineage model for the liver, pancreas, and biliary system. In this model, the ventral foregut progenitor expresses Hhex and Sox17. The high FGF/BMP environment adjacent to the cardiac mesoderm favors a liver fate (Hhex). Foregut cells caudal to the Hhex domain co-express Pdx1 and Sox17, and contribute to the ventral pancreas and biliary system. Segregation of biliary and pancreatic lineages depends on the cooperative activity of Sox17 and the Notch signaling effector Hes1 (Spence et al. 2009).
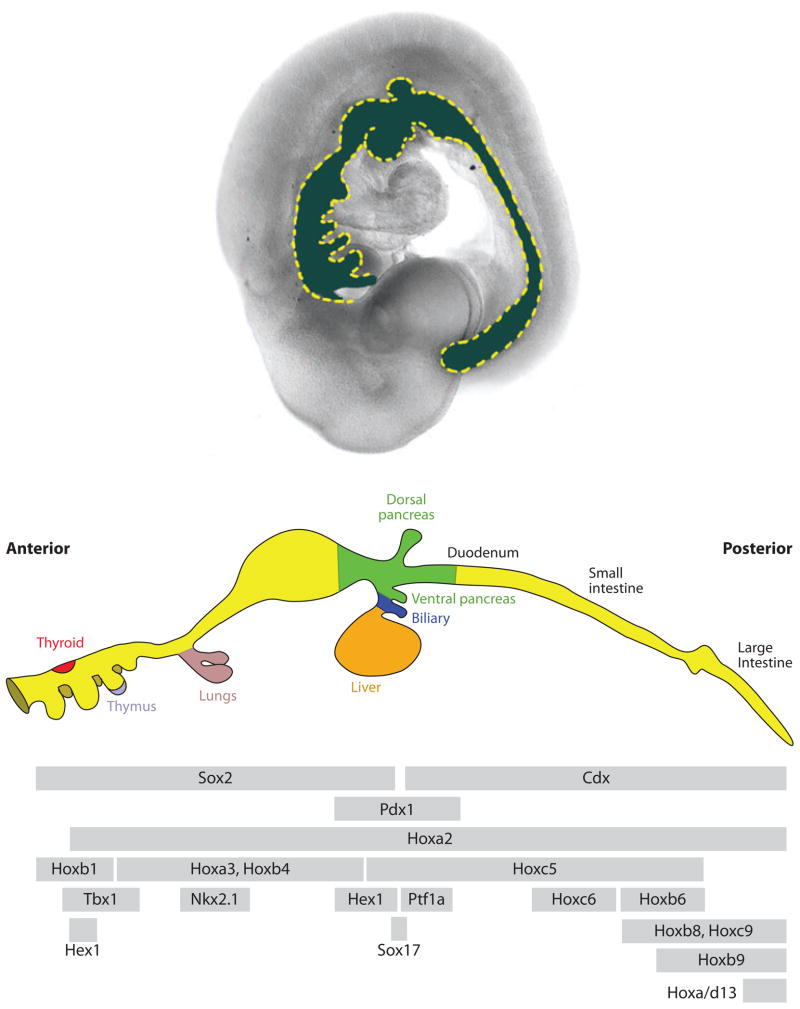
Overlapping expression domains of transcription factors along the A-P axis of the gut tube. The (upper panel) shows a lateral view of an e9.5 mouse embryo with the gut tube false-colored (blue). The middle panel shows a schematic diagram of the bud-stage gut (~E10.5 in mouse). The (lower panel) indicates the relative A-P expression boundaries of several transcription factors. The expression of these factors is temporally dynamic, and these expression domains are not necessarily maintained throughout development. For example, Hhex is first expressed in one domain in the ventral foregut, then it is expressed in the presumptive thyroid and liver. The anterior and posterior expression limits on some of these factors are important in establishing organ domains. The lower panel was adapted from Grapin-Botton (2005).
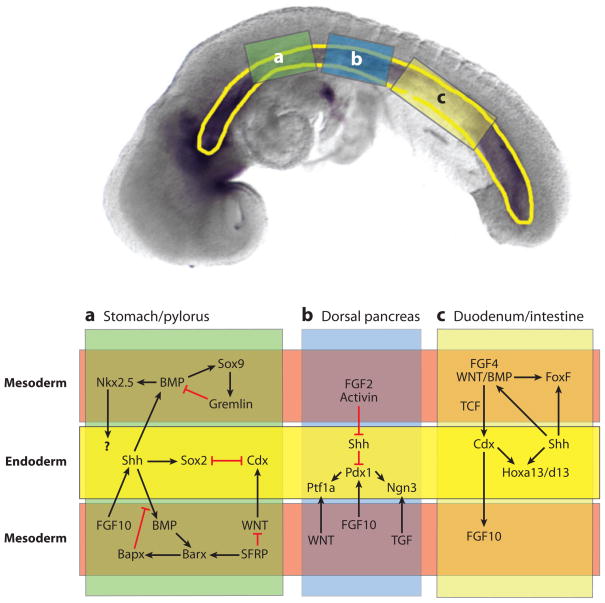
Reciprocal epithelial-mesenchymal signaling in the gut tube during development of the stomach (a), pancreas (b), and duodenum/small intestine (c). The (upper panel) shows a 10-somite stage mouse embryo with the gut tube outlined in (yellow). The three boxes indicate the regions of the gut that give rise to the stomach (a), pancreas (b), and duodenum (c). The (lower panel) schematically shows these regions with the endoderm-epitheium (yellow) flanked by adjacent mesoderm-mesenchyme (above and below) (light red). The mesoderm was divided to allow for a summary of the multiple signaling cascades that have been identified in different species and at different stages of development. This schematic broadly summarizes our current understanding. In some cases the molecular relationships depicted have been directly demonstrated, whereas in other cases, we have inferred a connection from studies in other species.
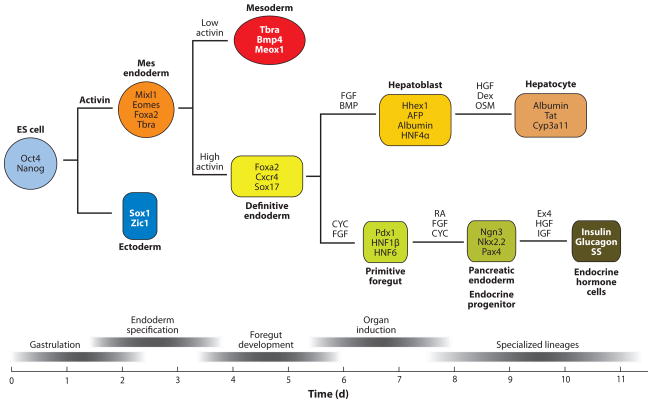
Generating hepatocytes and β-cells from embryonic stem cells. The top diagram schematically shows the lineage relationship between ES cells, endoderm, liver, and pancreas. The lower panel shows the relative developmental stage and time in culture (days – d). Culturing ES cells (ESCs) in activin mimics the activity of Nodal and induces specification of a mesendodermal progenitor. Persistent culture in high activin promotes definitive endoderm (DE) formation. DE cultures exposed to hepatic inducing factors (FGF and/or BMP) form hepatoblasts, whereas pancreatic inducing factors (CYC, cyclopamine; FGF10; and RA, Retinoic acid) promote posterior foregut and pancreatic fate. Further manipulations of the culture conditions promote formation of specialized organ lineages, such as hepatocytes and pancreatic endocrine cells. Molecular markers that define each cell type are shown within the colored box. Abbreviations: HGF, hepatocyte growth factor; Dex, dexamethazone; OSM, oncostatin M; AFP, alphafetoprotein; Tat, tyrosine amino transferase; Cyp3a11, cytochrome superfamily p450 member 3a11.
References
-
- Alexander J, Stainier DY. A molecular pathway leading to endoderm formation in zebrafish. Curr Biol. 1999;9:1147–57. - PubMed
-
- Aoki TO, David NB, Minchiotti G, Saint-Etienne L, Dickmeis T, et al. Molecular integration of casanova in the Nodal signaling pathway controlling endoderm formation. Development. 2002;129:275–86. - PubMed
-
- Bagnat M, Cheung ID, Mostov KE, Stainier DY. Genetic control of single lumen formation in the zebrafish gut. Nat Cell Biol. 2007;9:954–60. - PubMed
Publication types
MeSH terms
Grants and funding
LinkOut - more resources
Full Text Sources
Other Literature Sources
Miscellaneous
