. 2009 Jul 17;31(1):110-21.
doi: 10.1016/j.immuni.2009.04.015. Epub 2009 Jul 2.

Virus binding to a plasma membrane receptor triggers interleukin-1 alpha-mediated proinflammatory macrophage response in vivo

Affiliations

Virus binding to a plasma membrane receptor triggers interleukin-1 alpha-mediated proinflammatory macrophage response in vivo

Nelson C Di Paolo et al. Immunity. .

Abstract

The recognition of viral components by host pattern-recognition receptors triggers the induction of the antiviral innate immune response. Toll-like receptor 9 (TLR9) and NLRP3 inflammasome were shown to be the principal specific sensors of viral double-stranded DNA. Here we present evidence that macrophages in vivo activated an innate immune response to a double-stranded DNA virus, adenovirus (Ad), independently of TLR9 or NLRP3 inflammasome. In response to Ad, macrophage-derived IL-1 alpha triggered IL-1RI-dependent production of a defined set of proinflammatory cytokines and chemokines. The IL-1 alpha-mediated response required a selective interaction of virus arginine-glycine-aspartic acid (RGD) motifs with macrophage beta(3) integrins. Thus, these data identify IL-1 alpha-IL-1RI as a key pathway allowing for the activation of proinflammatory responses to the virus, independently of its genomic nucleic acid recognition.


Figures
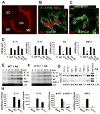
Figure 1
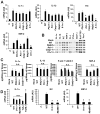
Figure 1. CD169- and MARCO-positive splenic marginal zone macrophages trap adenovirus and initiate an IL-1RI-dependent innate immune response in vivo.
(A) Distribution of Ad particles in the spleen 30 min after virus injection. RP- red pulp; GC-germinal center; MZ-marginal zone. Anti-Ad antibody stain is red. Co-localization of Ad particles (red) with (B) CD169- or (C) MARCO-positive macrophages in the splenic MZ. (D) mRNA levels for IL-1α, IL-1β, KC and MIP-2 in the spleen 30 min after Ad injection. N=4. * - P < 0.01. Except for the columns indicated by the star, no statistically significant differences between experimental groups and WT group were identified (P > 0.05). C –mock-infected mice, treated with saline. AU – arbitrary units. (E, F) Kinetics of the transcriptional activation of IL-1α, IL-1β, KC and MIP-2 in wild type (E) or Il-1r−/− (F) mice. Individual mice were injected with Ad and sacrificed at indicated time points. (G) Protein levels for pro-inflammatory cytokines and chemokines in spleen of wild type (WT) and Il-1r−/− mice 1 h after Ad injection. N=4. As a positive control for inflammatory cytokine and chemokine induction, mice were injected with LPS. (H) The amounts of pro-inflammatory cytokines and chemokines in the spleens of mice 1 h after Ad injection. N=3. Mock – negative control mice injected with saline * - P < 0.01.
Figure 2
Figure 2. IL-1α is the dominant mediator of an innate immune response to Ad in vivo
(A) The mRNA levels for IL-1α, IL-1β, KC and MIP-2 in spleens of mice 30 min after Ad injection. Biological duplicates are shown. C – mock-infected mice, injected with saline. (B) Quantitative representation of mRNA levels from the gel shown in (A) after phosphorimager analysis. N=6. n.s. – not statistically significant. * - P < 0.01. AU – arbitrary units. (C) IL-1α, IL-1β, and MIP-2 mRNA levels in livers of mice 30 min after Ad injection. N=3. (D) Quantitative representation of mRNA levels from the gel shown in (C) after phosphorimager analysis. N=6. n.s. – not statistically significant. * - P < 0.01. (E) Protein levels of inflammatory cytokines and chemokines in spleens 1 h after Ad injection. Pos-C are dots that show the manufacturer’s internal positive control samples on the membrane. Control – the spleen protein sample of a mouse injected with saline. (F) The amounts of pro-inflammatory cytokines and chemokines in the spleens of mice 1 hour after Ad injection. N=4. Mock – negative control mice injected with saline. n.s. – not statistically significant. * - P < 0.01.
Figure 3
Figure 3. Ad induces expression of IL-1α and its translocation to the nuclei in marginal zone macrophages
Immunofluorescent and confocal microscopy analysis of IL-1α expression on spleen sections of mock-injected (A) or Ad-injected mice at 1 h (B) or 3 h (C) post injection. The physical border of the germinal centers are depicted by punctuate lines. Confocal microscopy analysis confirms co-localization of IL-1α positive staining with marginal zone macrophage staining (D-F). Arrows indicate CD169-positive cells in the marginal zone, co-localized with IL-1α-positive staining. Representative pictures are shown. N=5. Confocal microscopy analysis shows the co-localization of nuclei of splenic marginal zone cells stained with DAPI (blue, G), IL-1α (red, H), and CD169 macrophage marker (I). Macrophage cells with co-localized DAPI and IL-1α staining are shown by arrows. (J). Semi-quantitative presentation of the proportion of IL-1α-expressing marginal zone cells with IL-1α-positive nuclei in mock-injected mice and Ad injected mice. The nuclear IL-1α-positive staining was analyzed in two hundred IL-1α-positive cells on spleen sections of the Ad-injected group. No IL-1α-positive nuclei were found on spleen sections of mock-injected animals. N=6. * - P < 0.01.
Figure 4
Figure 4. Activation of an IL-1α-mediated innate response to Ad does not depend on NALP3-inflammasome, MyD88, TRIF, or TRAF6
(A) Mice were injected with Ad and mRNA levels for IL-1α, IL-1β, KC and MIP-2 were analyzed 30 min p.i. N=4. Except for the columns indicated by the star, no statistically significant differences between experimental groups and WT group were identified (P > 0.05). * - P < 0.01. C – mock-infected mice, treated with saline. AU – arbitrary units. (B) Analysis of proteins in spleens of mice 1 hour after Ad injection. N=4. Mock – negative control mice injected with saline. Pos-C are dots that show the manufacturer’s internal positive control samples on the membrane. (C) The amounts of pro-inflammatory cytokines and chemokines in the spleens of mice 1 hour after Ad injection. N=3. Mock – negative control mice injected with saline. n.s. – no statistically significant difference were identified between WT and gene knockout animals (P > 0.05). (D) IL-1α, MIP-2 and KC mRNA levels in spleens of mice 30 min after Ad injection. N=4. * - P < 0.01. C – mock-infected mice, treated with saline. n.s. - not statistically significant.
Figure 5
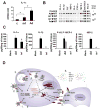
Figure 5. The engagement of β3 integrins by Ad is critical for initiation of the innate immune response
(A) The mRNA levels for IL-1α, IL-1β, KC and MIP-2 in spleens of wild type mice (WT) and mice knockout for β 3-, β5-, or conditionally knockout for β1-integrin in hematopoietic cells (β1−/−), as well as WT mice injected with Ad mutant lacking an RGD motif within its penton protein (AdΔRGD) 30 min after virus injection. N=3. C – mock-infected mice, injected with saline. (B) Quantitative representation mRNA levels from the gel shown in (A) after phosphorimager analysis. N=6. Statistically significant differences between experimental groups and mock-injected controls [C] or WT injected with Ad are indicated by the star. * - P < 0.01. WT mice injected with AdΔRGD are indicated by the arrow. AU – arbitrary units. (C) IL-1α, IL-1β, and MIP-2 mRNA levels in livers of mice shown in (A). N=3. (D) Quantitative representation mRNA levels from the gel shown in (C) after phosphorimager analysis. N=6. Statistically significant differences between experimental groups and WT mice injected with Ad are indicated by the star. * - P < 0.01. (E) Protein levels of cytokines and chemokines in spleens of mice knockout for integrins β1, β2, β3, or WT mice injected with Ad or AdΔRGD 1 hour after virus injection. N=4. Pos-C are dots that show the manufacturer’s internal positive control samples on the membrane. Control – the spleen protein sample of a mouse injected with saline. (F) The amounts of cytokines and chemokines in the spleens of mice 1 hour after Ad injection. N=4. Mock – negative control mice injected with saline. Statistically significant differences between experimental groups and WT mice injected with Ad are indicated by the star. * - P < 0.01.
Figure 6
Figure 6. Confocal microscopy analysis of IL-1α translocation into the nuclei of marginal zone macrophages in WT mice and β3 integrin knockout mice injected with Ad, or WT mice injected with AdΔRGD mutant
Mice were injected intravenously with a high dose of the indicated viruses (1011 virus particles per mouse), and 3 hours later spleens were harvested and sections were prepared and stained with DAPI (blue) to detect nuclei of splenocytes, as well as Abs specific for CD169 (green) or IL-1α (red). Confocal images were obtained using a Zeiss 510 Meta Confocal microscope. The physical border of splenic germinal centers are indicated by punctuate lines. Marginal zone macrophages expressing IL-1α are indicated by arrows. Representative pictures are shown. N=4.
Figure 7
Figure 7. Transcriptional and functional activation of IL-1α in response to ts1 mutant virus and the model of IL-1α-mediated activation of the innate immune response to Ad by macrophages in vivo
(A) Mice were injected with Ad or ts1 mutant and mRNA levels for IL-1α were analyzed 30 min p.i. N=4. * - P < 0.01. C – mock-infected mice, treated with saline. AU – arbitrary units. (B) Analysis of proteins in spleens of mice 1 hour after Ad or ts1 injection at indicated doses. N=4. Mock – negative control mice injected with saline. Pos-C are dots that show the manufacturer’s internal positive control samples on the membrane. (C) The amounts of pro-inflammatory cytokines and chemokines in the spleens of mice 1 hour after Ad or ts1 injection. N=3. Mock – negative control mice injected with saline.* - P < 0.01. (D) Model of Ad induction of IL-1α that triggers the activation of macrophage innate immune and inflammatory responses in vivo. 1. Ad interaction with a macrophage receptor induces transcription and synthesis of pre-IL-1α. 2–4. β3 integrin interaction with virus RGD motifs triggers intracellular signaling that promotes virus internalization into the cell and endosome rupture, thus, leading to the amplification of IL-1α gene transcription, pre-IL-1α processing, translocation of IL-1α -NTP to the nucleus, and enabling mature IL-1α to initiate IL-1RI signaling. 5. IL-1α -mediated IL-1RI signaling leads to the activation and production of pro-inflammatory cytokines and chemokines, including KC, MIP-2, MCP-1, and IL-6.

Comment in

Similar articles

Cited by

References

    1. Attur MG, Dave MN, Clancy RR, Patel IR, Abramson SB, Amin AR. Functional genomic analysis in arthritis-affected cartilage: Yin-yang regulation of inflammatory mediators by alpha(5)beta(1) and alpha(v)beta(3) integrins. Journal of Immunology. 2000;164:2684–2691. - PubMed
    1. Brunetti-Pierri N, Palmer DJ, Beaudet AL, Carey KD, Finegold M, Ng P. Acute toxicity after high-dose systemic injection of helper-dependent adenoviral vectors into nonhuman primates. Hum Gene Ther. 2004;15:35–46. - PubMed
    1. Chang CH, Huang Y, Anderson R. Activation of vascular endothelial cells by IL-1 alpha released by epithelial cells infected with respiratory syncytial virus. Cellular Immunology. 2003;221:37–41. - PubMed
    1. Chang CH, Huang Y, Issekutz AC, Griffith M, Lin KH, Anderson R. Interleukin-1 alpha released from epithelial cells after adenovirus type 37 infection activates intercellular adhesion molecule 1 expression on human vascular endothelial cells. Journal of Virology. 2002;76:427–431. - PMC - PubMed
    1. Chen CJ, Kono H, Golenbock D, Reed G, Akira S, Rock KL. Identification of a key pathway required for the sterile inflammatory response triggered by dying cells. Nature Medicine. 2007;13:851–856. - PubMed

Publication types

MeSH terms