. 2009 Oct 1;315(16):2802-17.
doi: 10.1016/j.yexcr.2009.06.028. Epub 2009 Jul 2.

Adenylate cyclase regulates elongation of mammalian primary cilia

Affiliations

Adenylate cyclase regulates elongation of mammalian primary cilia

Young Ou et al. Exp Cell Res. .

Abstract

The primary cilium is a non-motile microtubule-based structure that shares many similarities with the structures of flagella and motile cilia. It is well known that the length of flagella is under stringent control, but it is not known whether this is true for primary cilia. In this study, we found that the length of primary cilia in fibroblast-like synoviocytes, either in log phase culture or in quiescent state, was confined within a range. However, when lithium was added to the culture to a final concentration of 100 mM, primary cilia of synoviocytes grew beyond this range, elongating to a length that was on average approximately 3 times the length of untreated cilia. Lithium is a drug approved for treating bipolar disorder. We dissected the molecular targets of this drug, and observed that inhibition of adenylate cyclase III (ACIII) by specific inhibitors mimicked the effects of lithium on primary cilium elongation. Inhibition of GSK-3beta by four different inhibitors did not induce primary cilia elongation. ACIII was found in primary cilia of a variety of cell types, and lithium treatment of these cell types led to their cilium elongation. Further, we demonstrate that different cell types displayed distinct sensitivities to the lithium treatment. However, in all cases examined primary cilia elongated as a result of lithium treatment. In particular, two neuronal cell types, rat PC-12 adrenal medulla cells and human astrocytes, developed long primary cilia when lithium was used at or close to the therapeutic relevant concentration (1-2 mM). These results suggest that the length of primary cilia is controlled, at least in part, by the ACIII-cAMP signaling pathway.


Figures

Figure 1
Figure 1. Lithium induces primary cilia elongation in serum-starved FLS cells
Serum-starved cells were treated with 100 mM lithium chloride for 12 hrs, fixed with cold methanol, stained with anti-acetylated tubulin antibody, and examined by indirect immunofluorescence microscopy. Primary cilium elongation is seen in serum-starved FLS cells after lithium treatment. Control: untreated sample; Lithium: lithium-treated cells. Arrows denote the primary cilia.
Figure 2
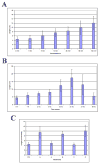
Figure 2. Dynamics of primary cilium elongation after lithium treatment
FLS cells were serum-starved for 48 hrs, and then were treated with lithium at various times and concentrations as indicated. Cells were fixed in cold methanol, stained with anti-acetylated tubulin antibody, and examined by indirect immunofluorescence microscopy. The lengths of primary cilia were measured as indicated in Materials and Methods. Panel A, dose-response of primary cilia length after lithium treatment for 12 hrs. Panel B, Time course of primary cilia length after lithium treatment at 100 mM concentration. Panel C, Protein synthesis inhibition and primary cilium elongation. Serum-starved FLS cells were treated as follows: CTL, primary cilia in untreated control cells. Cells were first incubated with serum-free medium for 3 hrs, followed by an additional 7 hrs fresh serum-free medium incubation. Li, lithium-treated cells. Cells were first incubated with serum-free medium for 3 hrs, followed by 100 mM lithium treatment for 7 hrs in serum-free medium. A–D, cells were treated with 50 μg/ml (A and B) or 250 μg/ml (C and D) of cycloheximide. A, 50 μg/ml cycloheximide for 10 hrs; B, 50 μg/ml cycloheximide for 3 hrs followed by co-treatment with 100 mM lithium/50 μg/ml cycloheximide for 7 hrs; C, 250 μg/ml cycloheximide for 10 hrs; D, 250 μg/ml cycloheximide for 3 hrs followed by co-treatment with 100 mM lithium/250 μg/ml cycloheximide for 7 hrs. Error bars indicate standard deviation.
Figure 3
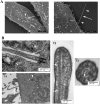
Figure 3. Ultrastructural analysis of primary cilia
A. Scanning electron microscopy. Left image, untreated FLS cells; Right image, lithium-treated FLS cells. FLS cells were treated with 100 mM lithium chloride for 12 hrs. Shown are the extracellular portion of the primary cilia (arrows) and potential IFT particles (arrowheads). Bar = 2 μm. B. Transmission electron microscopy. CTL, untreated control sample. The arrow points to the portion of a primary cilium that lies in an invagination of the plasma membrane. Note that the invagination is lined with Golgi complexes (arrowheads). T1–T3, serum-starved FLS cells treated with 100 mM lithium chloride for 12 hrs. T1, an elongated primary cilium extending from the basal body (arrowhead) into the invagination of the plasma membrane and protruding outside the cell (arrow). T2, longitudinal section of the tip of a primary cilium. T3, cross-section of an elongated primary cilium inside the invagination of the plasma membrane. Note that both longitudinal (T2, arrows) and cross-sections (T3, arrow) reveal double microtubules, and that these doublets extend to the tip of the cilium (T2). Bars in different images represent different length. CTL, bar = 400 nm; T1, bar = 500 nm; T2, bar = 100 nm. T2, bar = 100 nm.
Figure 4
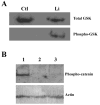
Figure 4. Protein phosphorylation or dephosphorylation after lithium treatment
FLS cells were serum-starved for 48 hrs and then were treated with 100 mM lithium chloride for 12 hrs. Cells were collected, and proteins were fractionated by SDS-PAGE. A, Western blot analysis of GSK-3β. Upper panel, total GSK-3β as revealed by using an antibody raised against unphosphorylated protein. Lower panel, phosphorylated GSK-3β as revealed by using an antibody specific for the phopsho-serine (Ser-9) epitope of the protein. Ctl, control cells treated with fresh serum-free medium; Li, cells treated with lithium. B, Western blot analysis of β-catenin. Upper panel, phosphorylated β-catenin detected using an antibody specific for phosphorylated (Thr-41/Ser-37/Ser-33) β-catenin protein. Lower panel, actin proteins detected using anti-β-actin antibody, indicating protein loading. Lane 1, cells treated with fresh serum-free medium; Lane 2, cells treated with lithium; Lane 3, cells treated with GSK-3β inhibitor VII.
Figure 5
Figure 5. Protein kinases and primary cilia elongation
FLS cells were serum-starved for 48 hrs and then were treated with different drugs for various times. A, Serum-starved FLS cells were treated with valproate for 12 hrs at the indicated concentrations. The graphs show average length of 150 primary cilia from three independent experiments, with error bars showing standard deviation. CTL, control cells were treated with fresh serum-free medium; Lithium, cells were treated with 100 mM lithium; 1.56 mM-12.5, valproate concentrations (mM). B. Serum-starved FLS cells were treated with GSK-3 inhibitor VII for 12 hrs at the indicated concentrations. Shown is the average length of 150 primary cilia from three independent experiments, with error bars showing standard deviation. CTL, control cells treated with fresh serum-free medium; Lithium, cells treated with 100 mM lithium; 625–10000, GSK inhibitor VII concentrations (nM). C. Effect of protein kinase C inhibitor on primary cilia. Serum-starved FLS cells were treated with 10 μM PKC protein kinase inhibitor for 30 min, 1 hr and 3 hrs, respectively. Shown are average lengths of 150 primary cilia from three independent experiments with error bars showing standard deviation. CTL30minm CTL1hr, CTL3hr; control cells treated with fresh serum-free medium for 30 min, 1 hr and 3 hrs, respectively. PKCi30min, PKC1hr, PKCi3hr: cells treated with 10 μM PKC inhibitor for 30 min, 1 hr, and 3 hrs, respectively.
Figure 6
Figure 6. Adenylate cyclase III and primary cilia
Adenylate cyclase III is present at primary cilia of FLS cells. Serum-starved FLS cells were treated with lithium, fixed in cold methanol, and stained with antibodies to acetylated tubulin and adenylate cyclase III. Untreated, cells treated with fresh serum-free medium; Lithium, cells treated with 50 mM lithium for 12 hrs. Acety-tub, staining with anti-acetylated tubulin antibody; Cyclase, cells staining with anti-adenylate cyclase III antibody; Merge, composite of both images.
Figure 7
Figure 7. Adenylate cyclase III activity and primary cilia elongation
FLS cells were serum-starved for 48 hrs and then were treated with P-site inhibitors or activators. A, Cells were treated with adenosine 3′ monophosphate (3′-AMP) for 60 hrs. Shown are average lengths of 150 primary cilia obtained from three independent experiments, with error bars indicating standard deviation. Untreated, control cells receiving fresh serum-free medium; 1 mM and 5 mM, 3′-AMP concentrations. B, Serum-starved cells were treated with P-site inhibitor dideoxyadenosine triphosphates (DDAT) for 60 hrs. Shown are average lengths of 150 primary cilia from three independent experiments. Untreated, cells treated with fresh serum-free medium; 250 mM and 500 mM, DDAT concentrations. C, forskolin interference. Shown are average lengths of 150 primary cilia obtained from three independent experiments. Untreated, serum-starved cells incubated with fresh serum-free medium for 7 hrs; Li, cells treated with 50 mM lithium for 7 hrs; F, cells incubated with 0.5 mM forskolin for 7 hrs; F+L, cells first incubated with 0.5 mM mM forskolin for 2 hrs and then treated with 50 mM lithium for 7 hrs. D, 8-bromo-cAMP interference. Shown are average lengths of 150 primary cilia obtained from three independent experiments. Untreated, serum-starved cells incubated with fresh serum-free medium for 5 hrs; Li, cells treated with 25 mM lithium for 5 hrs; BcAMP, cells incubated with 100 μM 8-bromo-cAMP for 5 hrs; BcAMP+Li, cells first incubated with 100 μM 8-bromo-cAMP for 1 hr and then treated with 25 mM lithium for 5 hrs.
Figure 8
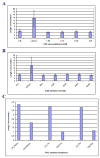
Figure 8. Dose response for lithium in two neuronal cell types
Cells were serum-starved for 48 hrs and then were treated with lithium at the concentrations indicated in the figure. A, PC-12 cells; B, astrocytes. Shown are average lengths of 150 primary cilia obtained from three independent experiments, with error bars indicating standard deviation.
Figure 9
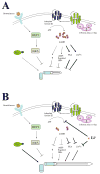
Figure 9. A model of primary cilia growth and elongation
A. Primary cilia in an untreated cell. Primary cilia start to form after mitosis. During the early stage of G1 (or experimentally in G0 cells) primary cilia start to grow. With cell cycle progression (or with time increase in the quiescent state), cAMP and calcium concentrations increase. With participation of other factors (including cAMP-responsive GTP exchange protein or unknown factors, PKC and Aurora kinase) the increased cAMP and calcium levels prevent primary cilia from further growth. At this stage, there is equilibrium between growth and regression of primary cilia, balanced by all factors. B. Lithium and primary cilia. Addition of lithium to the cell culture causes inhibition of adenylate cyclase III, reducing cAMP and calcium levels. Lithium may also directly attenuate the intracellular calcium concentration. As a result, lithium disturbs the balance, favoring primary cilia to resume their growth.

Similar articles

Cited by

References

    1. Alieva IB, Vorobjev IA. Vertebrate primary cilia: a sensory part of centrosomal complex in tissue cells, but a “sleeping beauty” in cultured cells? Cell Biol Int. 2004;28:139–150. - PubMed
    1. Allison JH, Stewart MA. Reduced brain inositol in lithium-treated rats. Nat New Biol. 1971;233:267–268. - PubMed
    1. Badano JL, Mitsuma N, Beales PL, Katsanis N. The ciliopathies: an emerging class of human genetic disorders. Annu Rev Genomics Hum Genet. 2006;7:125–148. - PubMed
    1. Bakalyar HA, Reed RR. Identification of a specialized adenylyl cyclase that may mediate odorant detection. Science. 1990;250:1403–1406. - PubMed
    1. Berbari NF, Bishop GA, Askwith CC, Lewis JS, Mykytyn K. Hippocampal neurons possess primary cilia in culture. J Neurosci Res. 2007;85:1095–1100. - PubMed

Publication types

MeSH terms

Grants and funding