. 2009 Sep;37(9):1108-20, 1120.e1-4.
doi: 10.1016/j.exphem.2009.06.008. Epub 2009 Jul 2.

Hematopoietic stem cell origin of adipocytes

Affiliations

Hematopoietic stem cell origin of adipocytes

Yasuhiko Sera et al. Exp Hematol. 2009 Sep.

Abstract

Objective: It has generally been believed that adipocytes are derived from mesenchymal stem cells via fibroblasts. We recently reported that fibroblasts/myofibroblasts in a number of tissues and organs are derived from hematopoietic stem cells (HSCs). In the present study, we tested the hypothesis that HSCs also give rise to adipocytes.

Materials and methods: Using transplantation of a single enhanced green fluorescent protein-positive (EGFP(+)) HSC and primary culture, we examined generation of adipocytes from HSCs.

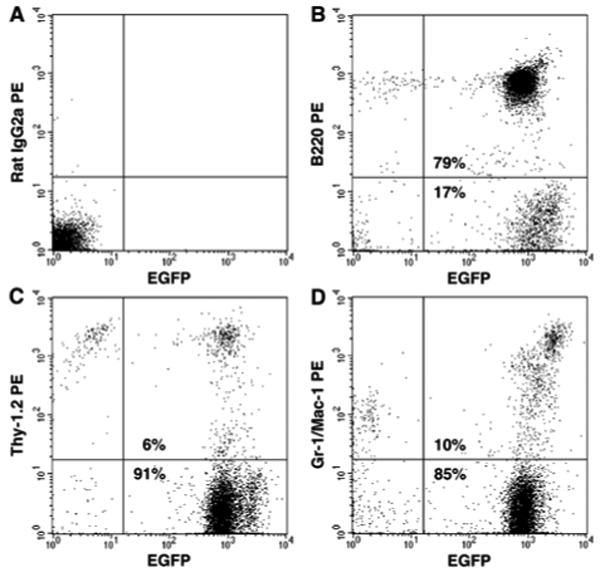
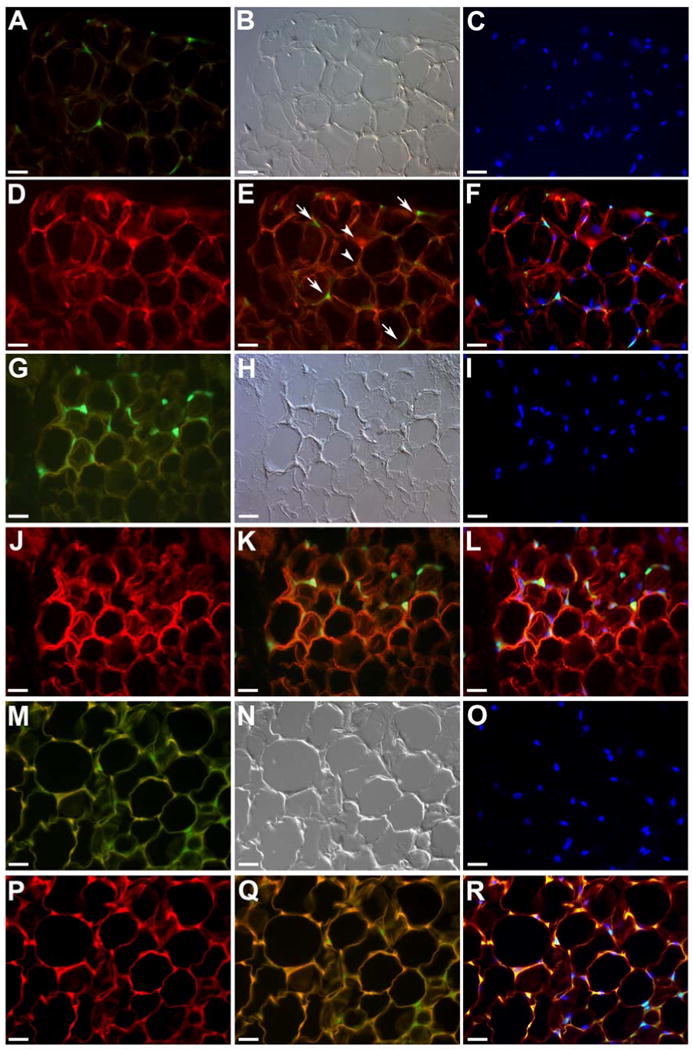
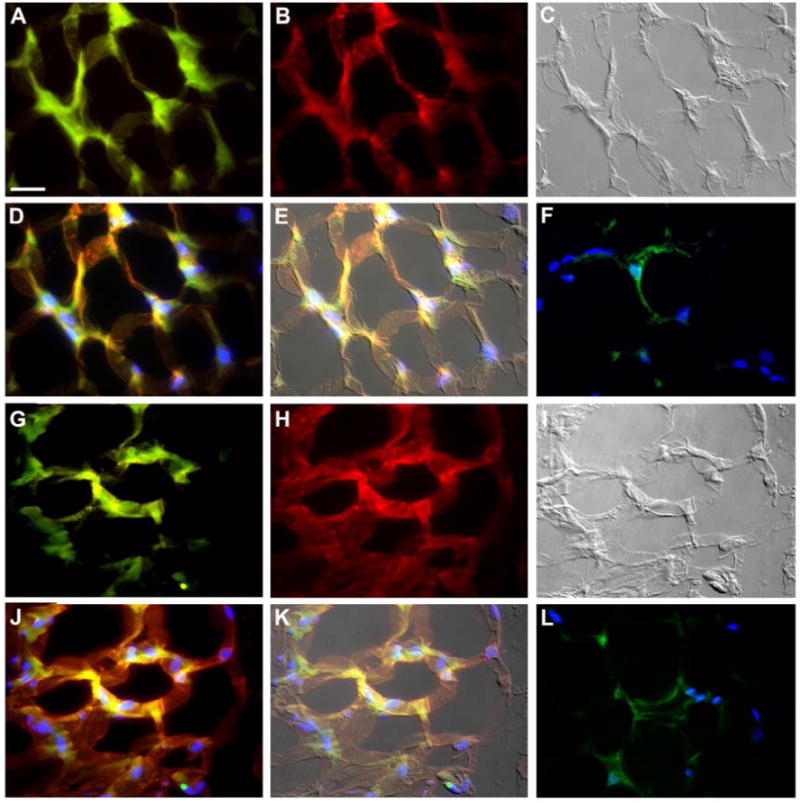
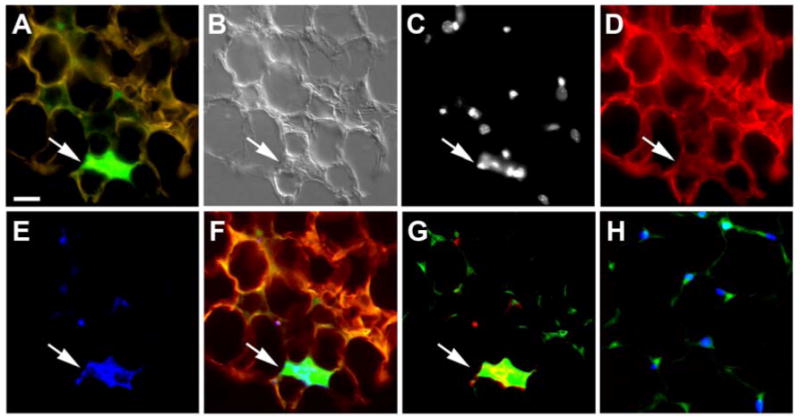
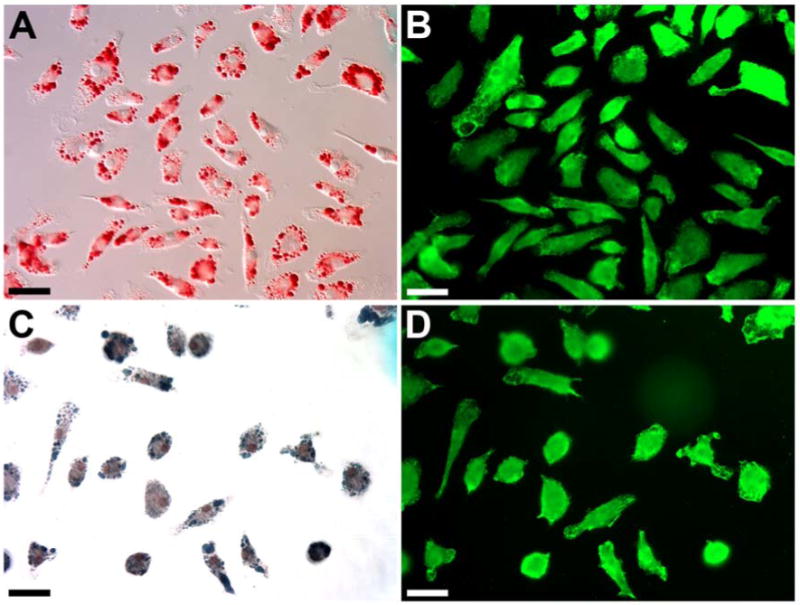
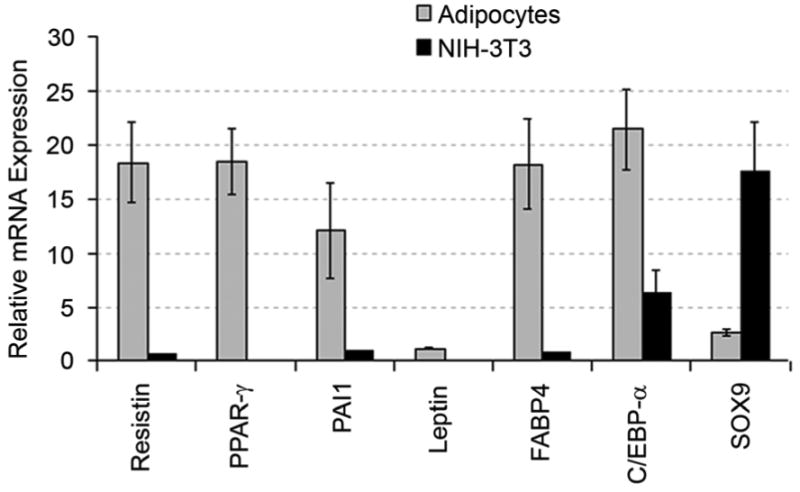
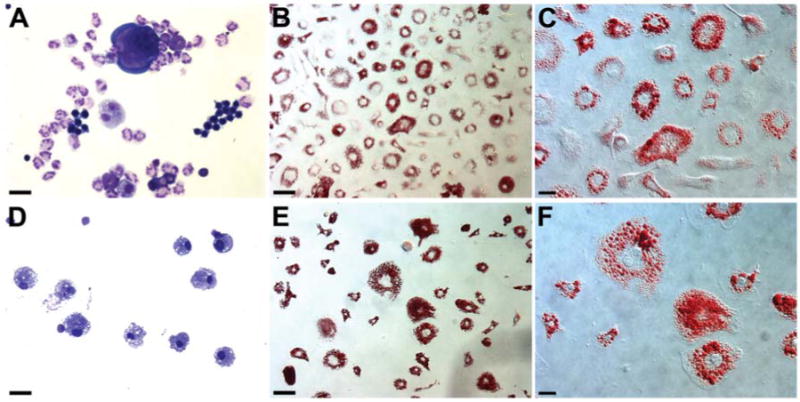
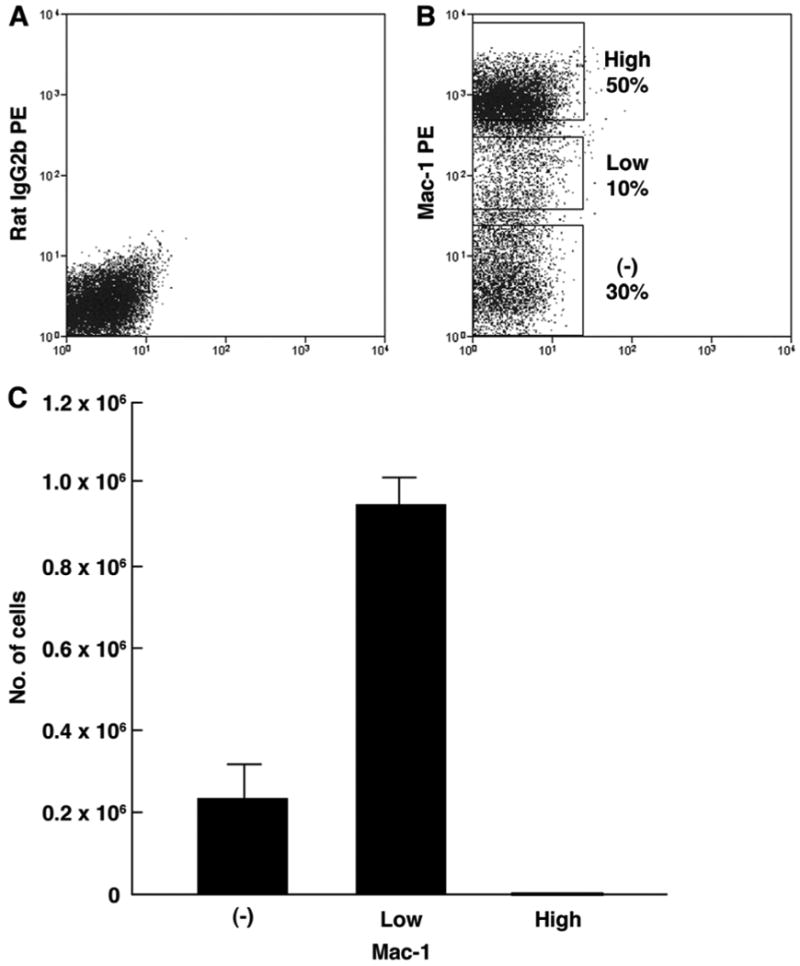
Results: Adipose tissues from clonally engrafted mice showed EGFP(+) adipocytes that stained positive for leptin, perilipin, and fatty acid binding protein 4. A diet containing rosiglitazone, a peroxisome proliferator-activated receptor-gamma agonist, significantly enhanced the number of EGFP(+) adipocytes. When EGFP(+) bone marrow cells from clonally engrafted mice were cultured under adipogenic conditions, all of the cultured cells stained positive with Oil Red O and Sudan Black B and exhibited the presence of abundant mRNA for adipocyte markers. Finally, clonal culture- and sorting-based studies of Mac-1 expression of hematopoietic progenitors suggested that adipocytes are derived from HSCs via progenitors for monocytes/macrophages.

Conclusion: Together, these studies clarify the current controversy regarding the ability of HSCs to give rise to adipocytes. Furthermore, our primary culture method that generates adipocytes from uncommitted hematopoietic cells should contribute to the studies of the mechanisms of early adipocytic differentiation and may lead to development of therapeutic solutions for many general obesity issues.


Conflict of interest statement

Conflict of Interest Disclosure: No financial interest/relationships with financial interest relating to the topic of this article have been declared.

Figures

Figure 1
Figure 1. Multilineage engraftment from a clone derived from a single EGFP+ HSC
Shown here is a representative flow cytometric analysis of PB nucleated cells from a mouse 7 months after transplantation of a clone derived from a single EGFP+ HSC. EGFP+ cells represented 96% of total nucleated cells and 79%, 6% and 10% of cells in the B cell (B), T cell (C) and granulocyte/macrophage (D) lineages, respectively. (A) Isotype control showing PB cells from a recipient C57BL/6-Ly5.1 mouse.
Figure 2
Figure 2. HSC derived adipocytes in vivo
Peritoneal, omental and peri-nephric fat pads from mice transplanted with a clonal population of cells derived from a single EGFP+ HSC were sectioned (5 μm) and examined using high magnification epifluorescent and DIC microscopy. Shown are representative sections from the peritoneal fat pads of a clonally engrafted mouse (A-F), a clonally engrafted mouse treated with rosiglitazone for one month (G-L) and a donor non-transplanted transgenic EGFP mouse (M-R). EGFP+ cells (A) with characteristic morphology of adipocytes (B, DIC image), including a ring of cytoplasm with a flattened nucleus located on the periphery (C, Hoechst nuclear dye, HO), were observed. Sections were then stained using antibodies to leptin (D). For analysis, the green EGFP image (A) was overlaid onto the red image of leptin (D) to demonstrate co-expression of EGFP and leptin (E, arrows). Arrowheads in E show EGFP negative adipocytes. Superimposition of EGFP (A), HO (C) and leptin stain (D) is shown in F. Representative images of the peritoneal fat pad from a rosiglitazone-treated clonally engrafted mouse are shown in Panels G-L. Clusters of EGFP+ adipocytes (G) seen in these sections were shown to express leptin (J), superimposition depicted in Panels K and L. Panels M-R show EGFP expression (M), morphology (N), HO staining (O) and leptin expression (P) of adipocytes from a donor transgenic EGFP mouse. Superimposition of images (Q, R) shows similar morphology and expression pattern to that of transplanted animals. See Figure S1, Panels M-P, for EGFP expression, DIC and negative control for leptin staining, respectively. Scale bar in A-R equals 25 μm.
Figure 3
Figure 3. Expression of perilipin and FABP4 by HSC-derived adipocytes
Shown is a section from a peritoneal fat pad of a clonally engrafted mouse treated with rosiglitazone for two months. High magnification imaging showed numerous clustered EGFP+ cells (A) that express perilipin (B) and have the morphology of adipocytes (C, DIC image). Superimposition of EGFP expression (green), perilipin staining (red) and nuclear staining (HO, blue) is shown in Panel D. Panel E shows D overlaid onto the DIC image. Staining of tissue sections with antibodies to FABP4 again shows clustered HSC-derived EGFP+ cells (G) that express FABP4 (H) and have the morphology of adipocytes (I, DIC image). Panels J and K show superimpositions with HO staining (J) as well as DIC overlay (K). Panels F and L show control images of tissue incubated with secondary but not primary antibodies for perilipin (F, red) or FABP4 (L, red) (green shows EGFP expression, blue shows HO staining). Scale bar in A-L equals 25 μm.
Figure 4
Figure 4. Adipose tissue contains few HSC-derived F4/80+ macrophages
Shown is a representative section from a peritoneal fat pad of a rosiglitazone treated, clonally engrafted mouse. Analysis of multiple sections shows few EGFP+ macrophages; representative macrophage shown by arrow (A, B). Staining with nuclear marker HO (C) and antibodies to leptin (D) and F4/80 (E) and superimposition shown in Panel F showed that these macrophages were large and multinucleated. Panel G depicts another demonstration of colocalization of EGFP and F4/80 in the macrophage (arrow). Here, EGFP (green) is superimposed with F4/80 (red). Panel H shows control image of tissue stained with secondary only antibodies for F4/80 (red) (green shows EGFP expression, blue shows HO staining). Scale bar in A-L equals 25 μm.
Figure 5
Figure 5. Adipocytes cultured from EGFP+ BM cells of a clonally engrafted mouse
EGFP+ cells were FACS-sorted from BM of a mouse with clonal HSC engraftment and cultured under adipogenic conditions. Cultured cells were stained with oil red O (A) or Sudan black B (C) and an anti-GFP antibody (B and D). Scale bar equals 50 μm.
Figure 6
Figure 6. RT-PCR analysis of the adipocytes derived from GFP+ bone marrow cells of a clonally transplanted mouse
Higher mRNA levels of the adipocyte differentiation-related genes were observed compared to NIH-3T3 fibroblasts used as control (p< 0.05). These findings offer biochemical support for our initial identification of these cells as adipocytes based on morphology and oil red O staining.
Figure 7
Figure 7. Hematopoiesis and adipogenesis observed from single hematopoietic progenitors
Aliquots of individual clones derived from single Lin- Sca-1+ CD34- SP cells were cultured under hematopoietic and adipogenic conditions and stained with either May-Grünwald Giemsa (A,D) or oil red O (B,C,E,F). Results shown are pictures of a clone generating neutrophil/macrophage/erythrocyte/megakaryocytic cells (A) and adipocytes (B, C) and a clone generating only macrophages (D) and adipocytes (E, F). Scale bar equals 50 μm (A, B, D, E) or 25 μm (C, F).
Figure 8
Figure 8. Adipogenesis in culture from BM cells with variable Mac-1 expression
(A) Isotype control for sorting. (B) Sorting gates used for Mac-1-, Mac-1low, Mac-1high cell populations of BM mononuclear cells from normal C57BL/6-Ly5.1 mice. (C) Numbers of adipocytes generated from the Mac-1-, Mac-1low, Mac-1high cell populations.

References

    1. Pittenger MF, Mackay AM, Beck SC, et al. Multilineage potential of adult human mesenchymal stem cells. Science. 1999;284:143–147. - PubMed
    1. Prockop DJ. Marrow stromal cells as stem cells for nonhematopoietic tissues. Science. 1997;276:71–74. - PubMed
    1. Gregoire FM. Adipocyte differentiation: from fibroblast to endocrine cell. Exp Biol Med (Maywood) 2001;226:997–1002. - PubMed
    1. Ntambi JM, Young-Cheul K. Adipocyte differentiation and gene expression. J Nutr. 2000;130:3122S–3126S. - PubMed
    1. Napolitano L. The Differentiation of White Adipose Cells. an Electron Microscope Study. J Cell Biol. 1963;18:663–679. - PMC - PubMed

Publication types

MeSH terms