

Real-time assessment of cardiac perfusion, coronary angiography, and acute intravascular thrombi using dual-channel near-infrared fluorescence imaging
- PMID: 19577070
- PMCID: PMC2706783
- DOI: 10.1016/j.jtcvs.2008.09.082
Real-time assessment of cardiac perfusion, coronary angiography, and acute intravascular thrombi using dual-channel near-infrared fluorescence imaging
Abstract
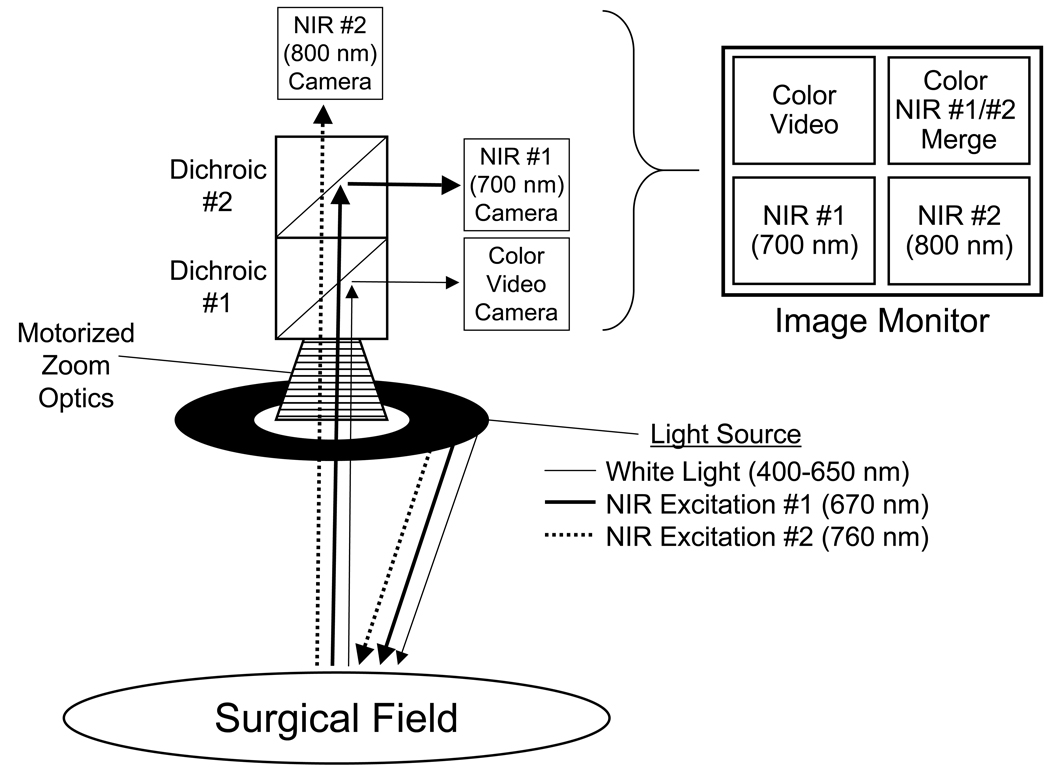
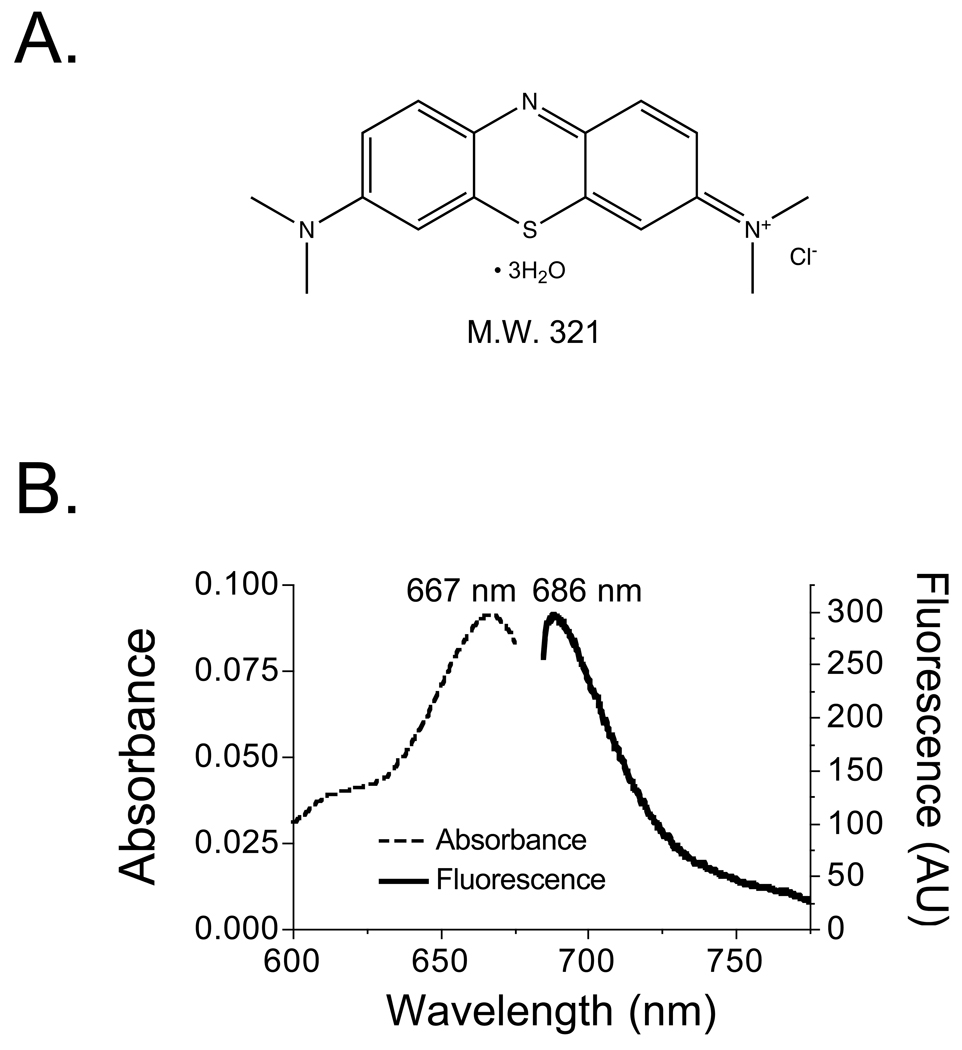
Objectives: We have developed an image-guided surgical system based on invisible near-infrared fluorescent light. Presently, the only clinically available near-infrared fluorophore is indocyanine green, which fluoresces at approximately 800 nm and is used for coronary angiography. Our objective was to determine whether methylene blue, already US Food and Drug Administration approved for other indications, has useful near-infrared fluorescence properties for image-guided cardiac surgery.
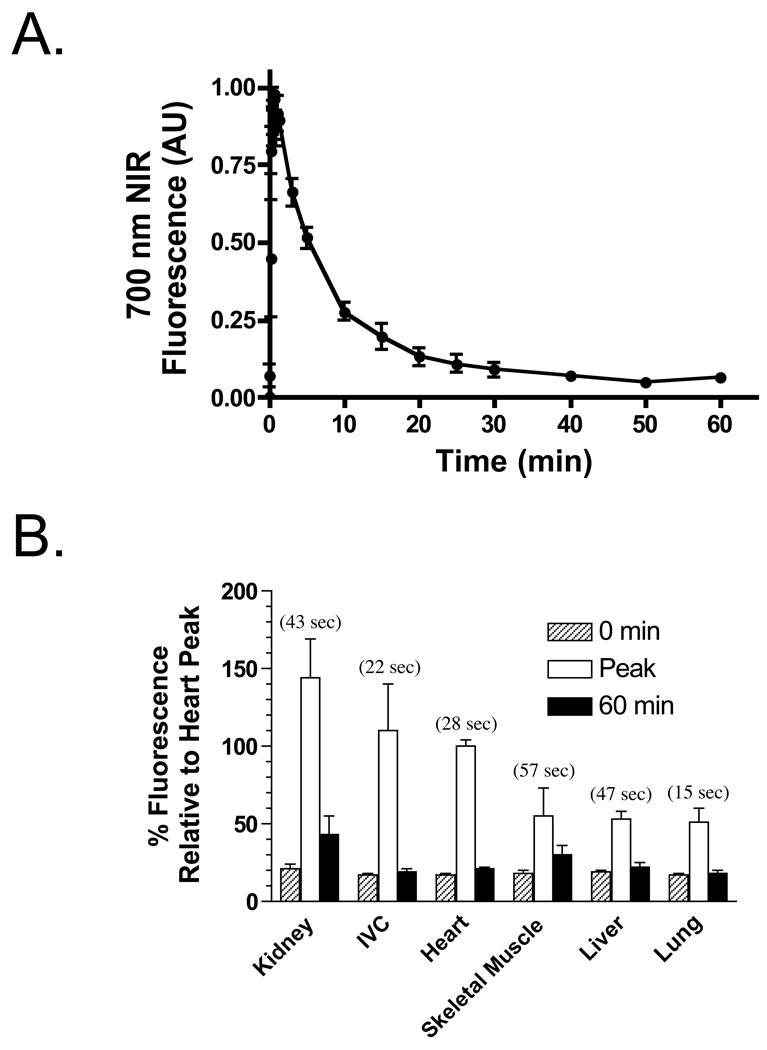
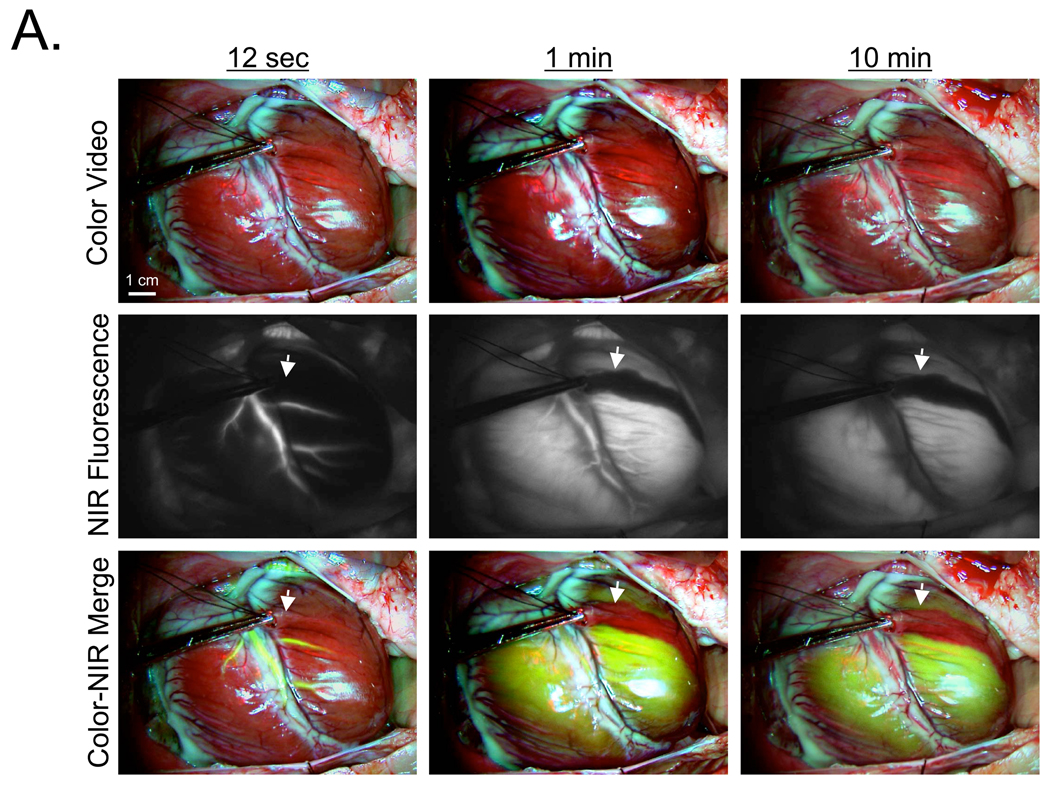
Methods: The optical properties of methylene blue were measured after dissolution in 100% serum. Biodistribution and clearance were quantified in organs and tissue after intravenous bolus injection of 2 mg/kg methylene blue in 3 rats. Coronary arteriography and cardiac perfusion were imaged in real time after intravenous bolus injection of 1 mg/kg methylene blue in 5 pigs with coronary obstructions. Coronary angiography and acute thrombi were assessed by using 800-nm fluorophores, indocyanine green, and IR-786-labeled platelets, respectively.
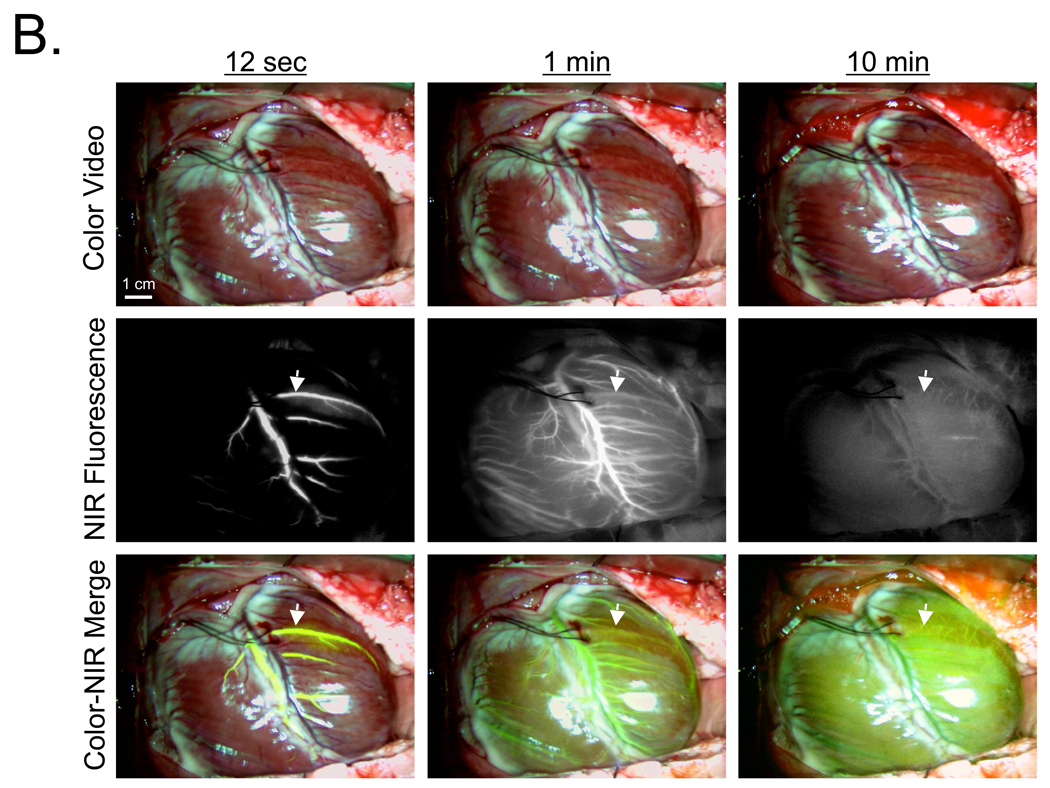
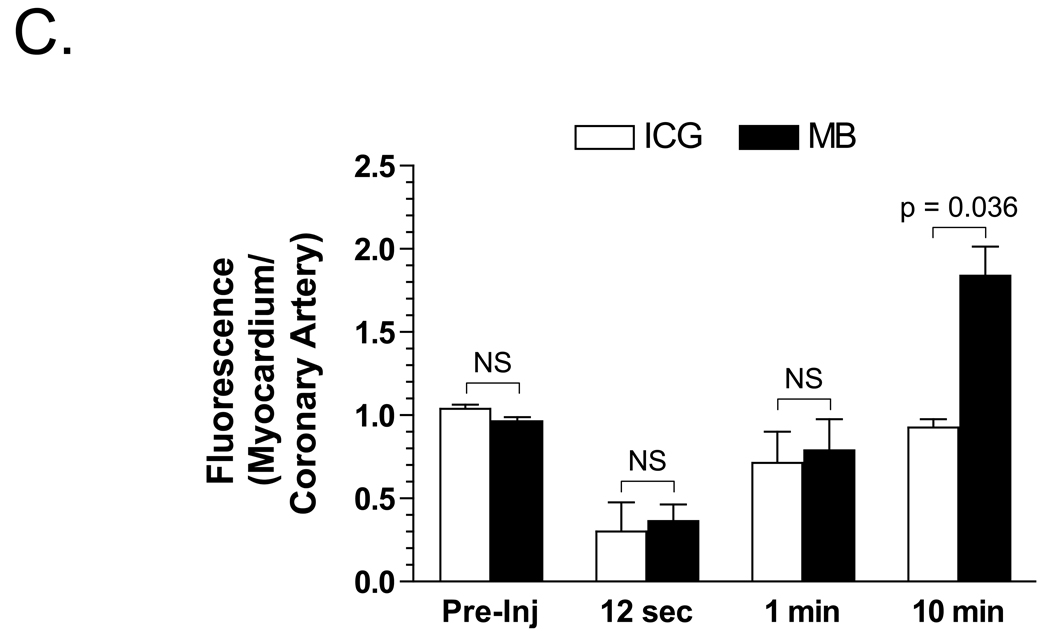
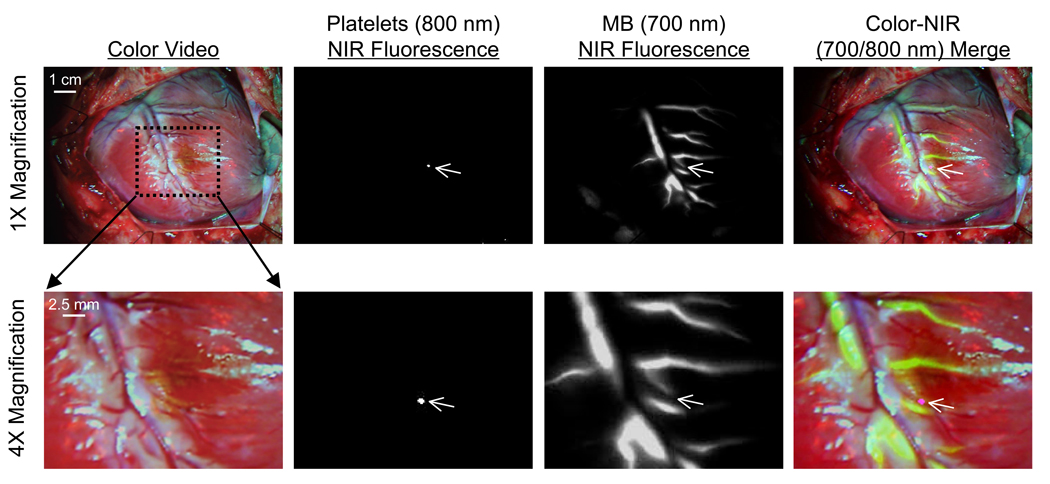
Results: The peak absorbance and emission of methylene blue as a near-infrared fluorophore occur at 667 nm and 686 nm, respectively. After intravenous injection, methylene blue provides highly sensitive coronary angiography. A lipophilic cation, methylene blue is extracted rapidly into tissue, with myocardium displaying unusually high uptake. Methylene blue permits real-time visualization and quantitative assessment of myocardial perfusion. Because of absent spectral overlap, use of 2 independent fluorophores in our imaging system permits simultaneous quantification of perfusion, venous drainage, and/or intravascular thrombi.
Conclusions: Methylene blue is an effective near-infrared fluorophore that provides direct visualization of coronary arteriography and cardiac perfusion. In conjunction with approximately 800-nm near-infrared fluorophores, important functional assessments during cardiac surgery are also possible.
Figures
Similar articles
-
Near-infrared fluorescence coronary angiography: a new noninvasive technology for intraoperative graft patency control.Heart Surg Forum. 2002;5(4):364-9. Heart Surg Forum. 2002. PMID: 12538119
-
Real-time intraoperative ureteral guidance using invisible near-infrared fluorescence.J Urol. 2007 Nov;178(5):2197-202. doi: 10.1016/j.juro.2007.06.049. Epub 2007 Sep 17. J Urol. 2007. PMID: 17870110 Free PMC article.
-
Intraoperative localization of insulinoma and normal pancreas using invisible near-infrared fluorescent light.Ann Surg Oncol. 2010 Apr;17(4):1094-100. doi: 10.1245/s10434-009-0868-8. Epub 2009 Dec 22. Ann Surg Oncol. 2010. PMID: 20033320 Free PMC article.
-
ZW800-1, a zwitterionic near-infrared fluorophore, and its cyclic RGD peptide derivative cyclo-(RGDyK)-ZW800-1.2013 Feb 12 [updated 2013 Feb 28]. In: Molecular Imaging and Contrast Agent Database (MICAD) [Internet]. Bethesda (MD): National Center for Biotechnology Information (US); 2004–2013. 2013 Feb 12 [updated 2013 Feb 28]. In: Molecular Imaging and Contrast Agent Database (MICAD) [Internet]. Bethesda (MD): National Center for Biotechnology Information (US); 2004–2013. PMID: 23469383 Free Books & Documents. Review.
-
Structure-Inherent Targeting of Near-Infrared Fluorophores for Image-Guided Surgery.Chonnam Med J. 2017 May;53(2):95-102. doi: 10.4068/cmj.2017.53.2.95. Epub 2017 May 25. Chonnam Med J. 2017. PMID: 28584787 Free PMC article. Review.
Cited by
-
Virus-mimicking nano-constructs as a contrast agent for near infrared photoacoustic imaging.Nanoscale. 2013 Mar 7;5(5):1772-6. doi: 10.1039/c3nr34124k. Epub 2013 Jan 21. Nanoscale. 2013. PMID: 23334567 Free PMC article.
-
Methylene Blue and Proflavine as Intraarterial Marker for Functional Perforazome-Comparative Study.J Pers Med. 2021 Feb 19;11(2):147. doi: 10.3390/jpm11020147. J Pers Med. 2021. PMID: 33669636 Free PMC article.
-
Review on Laser Technology in Intravascular Imaging and Treatment.Aging Dis. 2022 Feb 1;13(1):246-266. doi: 10.14336/AD.2021.0711. eCollection 2022 Feb. Aging Dis. 2022. PMID: 35111372 Free PMC article. Review.
-
High-precision tumor resection down to few-cell level guided by NIR-IIb molecular fluorescence imaging.Proc Natl Acad Sci U S A. 2022 Apr 12;119(15):e2123111119. doi: 10.1073/pnas.2123111119. Epub 2022 Apr 5. Proc Natl Acad Sci U S A. 2022. PMID: 35380898 Free PMC article.
-
Near-infrared fluorophores methylene blue for targeted imaging of the stomach in intraoperative navigation.Front Bioeng Biotechnol. 2023 Apr 13;11:1172073. doi: 10.3389/fbioe.2023.1172073. eCollection 2023. Front Bioeng Biotechnol. 2023. PMID: 37122852 Free PMC article.
References
-
- Chesebro JH, Clements IP, Fuster V, Elveback LR, Smith HC, Bardsley WT, et al. A platelet-inhibitor-drug trial in coronary-artery bypass operations: benefit of perioperative dipyridamole and aspirin therapy on early postoperative vein-graft patency. N Engl J Med. 1982;307:73–78. - PubMed
-
- FitzGibbon GM, Burton JR, Leach AJ. Coronary bypass graft fate: angiographic grading of 1400 consecutive grafts early after operation and of 1132 after one year. Circulation. 1978;57:1070–1074. - PubMed
-
- Frangioni JV. In vivo near-infrared fluorescence imaging. Curr Opin Chem Biol. 2003;7:626–634. - PubMed
-
- Ohnishi S, Lomnes SJ, Laurence RG, Gogbashian A, Mariani G, Frangioni JV. Organic alternatives to quantum dots for intraoperative near-infrared fluorescent sentinel lymph node mapping. Mol Imaging. 2005;4:172–181. - PubMed
Publication types
MeSH terms
Substances
Grants and funding
LinkOut - more resources
Full Text Sources
Other Literature Sources
