. 2009 Jul;138(1):185-91.
doi: 10.1016/j.jtcvs.2008.12.024. Epub 2009 Mar 13.

Increased vascular permeability after cardiopulmonary bypass in patients with diabetes is associated with increased expression of vascular endothelial growth factor and hepatocyte growth factor

Affiliations

Increased vascular permeability after cardiopulmonary bypass in patients with diabetes is associated with increased expression of vascular endothelial growth factor and hepatocyte growth factor

Sirisha Emani et al. J Thorac Cardiovasc Surg. 2009 Jul.

Abstract

Background: Several inflammatory mediators such as vascular endothelial growth factor and hepatocyte growth factor are known to play a critical role in the regulation of vascular permeability and angiogenesis. We studied the serum levels of growth factors and gene expression profiles of genes involved in growth factor signaling in the peripheral blood of patients with and patients without diabetes following cardiopulmonary bypass and cardioplegic arrest.

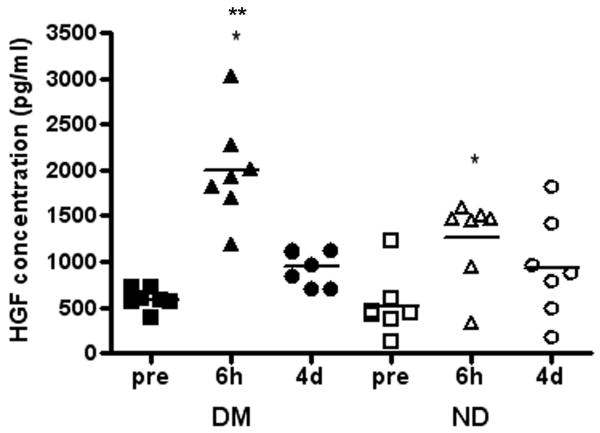
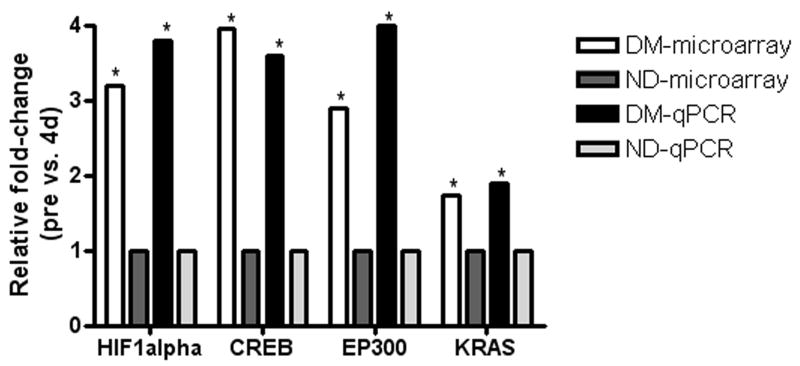
Methods: Serum and total RNA were obtained from the blood samples collected from patients with diabetes and matched patients without diabetes (n = 7 patients each) who had coronary artery bypass graft before and 6 hours and 4 days after cardiopulmonary bypass/cardioplegic arrest. The cytokine panel, consisting of growth factors such as vascular endothelial growth factor, hepatocyte growth factor, fibroblast growth factor, and epidermal growth factor, was quantified in patients with diabetes and patients without diabetes before and 6 hours and 4 days post-cardiopulmonary bypass/cardioplegic arrest using multiplex cytokine quantification system. cDNA microarray analysis was performed and fold-change was calculated.

Results: Length of hospitalization (10 vs 6 days; P = .04) and weight gain (5 vs 2.5 kg; P = .001) were significantly greater for patients with diabetes compared with patients without diabetes. The serum levels of vascular endothelial growth factor and hepatocyte growth factor were significantly elevated in patients with diabetes when compared with patients without diabetes before versus 6 hours post-cardiopulmonary bypass/cardioplegic arrest. In addition, significantly elevated mRNA expression of hypoxia-inducible factor-1alpha, cyclic adenosine monophosphate response element binding protein, and E1A binding protein p300 (more than twofold) was observed 4 days post-cardiopulmonary bypass/cardioplegic arrest exclusively in patients with diabetes.

Conclusions: The differential profile of gene and protein expression of growth factors and their related genes in patients with diabetes and patients without diabetes could be associated with increased edema and weight gain in patients with diabetes after cardiopulmonary bypass/cardioplegic arrest.


Figures

Figure 1
Figure 1
VEGF cytokine expression in DM and ND patients pre-surgery (pre), 6h post-surgery (6h), and 4d post-surgery (4d). (A) VEGF concentrations (pg/ml) in the serum of DM and ND patients (n=7 each) at the indicated time points. Asterisks (*) in (A) indicate significant differences in cytokine expression pre compared to 6h or 4d for the specific population (DM or ND). (B) Relative VEGF concentration pre compared to 6h or 4d. Asterisks (*) in (B) indicate significant differences in relative cytokine expression DM vs. ND at that time point. *p-values < 0.05 were considered significant. DM: patients with diabetes; ND: patients without diabetes. Closed squares: pre (DM); closed triangles: 6h (DM); closed circles: 4d (DM); open squares: pre (ND); open triangles: 6h (ND); and open circles: 4d (ND).
Figure 1
Figure 1
VEGF cytokine expression in DM and ND patients pre-surgery (pre), 6h post-surgery (6h), and 4d post-surgery (4d). (A) VEGF concentrations (pg/ml) in the serum of DM and ND patients (n=7 each) at the indicated time points. Asterisks (*) in (A) indicate significant differences in cytokine expression pre compared to 6h or 4d for the specific population (DM or ND). (B) Relative VEGF concentration pre compared to 6h or 4d. Asterisks (*) in (B) indicate significant differences in relative cytokine expression DM vs. ND at that time point. *p-values < 0.05 were considered significant. DM: patients with diabetes; ND: patients without diabetes. Closed squares: pre (DM); closed triangles: 6h (DM); closed circles: 4d (DM); open squares: pre (ND); open triangles: 6h (ND); and open circles: 4d (ND).
Figure 2
Figure 2
HGF cytokine expression in DM and ND patients pre-surgery (pre), 6h post-surgery (6h), and 4d post-surgery (4d). (A) HGF concentrations (pg/ml) in the serum of DM and ND patients (n=7 each) at the indicated time points. Asterisks (*) in (A) indicate significant differences in cytokine expression pre compared to 6h or 4d for the specific population (DM or ND). Double asterisks (**) in (A) indicates significant differences in concentration of HGF; DM vs. ND at that time-point. (B) Relative HGF concentration pre compared to 6h or 4d. Asterisks (*) in (B) indicate significant differences in the relative cytokine expression DM vs. ND at that time point. *p-values < 0.05 were considered significant. DM: patients with diabetes mellitus; ND: patients without diabetes mellitus. Closed squares: pre (DM); closed triangles: 6h (DM); closed circles: 4d (DM); open squares: pre (ND); open triangles: 6h (ND); and open circles: 4d (ND).
Figure 2
Figure 2
HGF cytokine expression in DM and ND patients pre-surgery (pre), 6h post-surgery (6h), and 4d post-surgery (4d). (A) HGF concentrations (pg/ml) in the serum of DM and ND patients (n=7 each) at the indicated time points. Asterisks (*) in (A) indicate significant differences in cytokine expression pre compared to 6h or 4d for the specific population (DM or ND). Double asterisks (**) in (A) indicates significant differences in concentration of HGF; DM vs. ND at that time-point. (B) Relative HGF concentration pre compared to 6h or 4d. Asterisks (*) in (B) indicate significant differences in the relative cytokine expression DM vs. ND at that time point. *p-values < 0.05 were considered significant. DM: patients with diabetes mellitus; ND: patients without diabetes mellitus. Closed squares: pre (DM); closed triangles: 6h (DM); closed circles: 4d (DM); open squares: pre (ND); open triangles: 6h (ND); and open circles: 4d (ND).
Figure 3
Figure 3
Hypoxia signaling pathway in DM patients 4d post-CPB/C. Genes colored in dark gray indicate up-regulated genes and in light gray represent down- regulated genes in DM patients. None of the genes in this pathway were up- or down- regulated in ND patients at 4d post CPB/C. Data was analyzed through the use of Ingenuity Pathway analysis (Ingenuity Systems, www.ingenuity.com). DM: patients with diabetes mellitus; ND: patients without diabetes mellitus.
Figure 4
Figure 4
Validation and comparison of up-regulated genes (exclusively in DM patients) in the hypoxia-signaling pathway using quantitative real-time PCR vs. microarray analysis. *Asterisks indicate significant differences between DM vs. ND patients (p <0.001). DM: patients with diabetes mellitus; ND: patients without diabetes mellitus.
Figure 5
Figure 5
CRP cytokine expression profile in DM and ND patients pre-surgery (pre), 6h post-surgery (6h), and 4d post-surgery (4d). (A) CRP concentrations (pg/ml) in the serum of DM and ND patients (n=7 each) at the indicated time points. Asterisks (*) in (A) indicate significant differences in cytokine expression pre compared to 6h or 4d for the specific population (DM or ND). (B) Relative CRP concentration pre compared to 6h or 4d. Asterisks (*) in (B) indicate significant differences in relative cytokine expression DM vs. ND at that time point. *p-values < 0.05 were considered significant. DM: patients with diabetes; ND: patients without diabetes. Closed squares: pre (DM); closed triangles: 6h (DM); closed circles: 4d (DM); open squares: pre (ND); open triangles: 6h (ND); and open circles: 4d (ND).
Figure 5
Figure 5
CRP cytokine expression profile in DM and ND patients pre-surgery (pre), 6h post-surgery (6h), and 4d post-surgery (4d). (A) CRP concentrations (pg/ml) in the serum of DM and ND patients (n=7 each) at the indicated time points. Asterisks (*) in (A) indicate significant differences in cytokine expression pre compared to 6h or 4d for the specific population (DM or ND). (B) Relative CRP concentration pre compared to 6h or 4d. Asterisks (*) in (B) indicate significant differences in relative cytokine expression DM vs. ND at that time point. *p-values < 0.05 were considered significant. DM: patients with diabetes; ND: patients without diabetes. Closed squares: pre (DM); closed triangles: 6h (DM); closed circles: 4d (DM); open squares: pre (ND); open triangles: 6h (ND); and open circles: 4d (ND).

Similar articles

Cited by

References

    1. Lauruschkat AH, Arnrich B, Albert AA, Walter JA, Amann B, Rosendahl UP, et al. Prevalence and risks of undiagnosed diabetes mellitus in patients undergoing coronary artery bypass grafting. Circulation. 2005 Oct 18;112(16):2397–402. - PubMed
    1. Furnary AP, Zerr KJ, Grunkemeier GL, Starr A. Continuous intravenous insulin infusion reduces the incidence of deep sternal wound infection in diabetic patients after cardiac surgical procedures. Ann Thorac Surg. 1999 Feb;67(2):352–60. discussion 60-2. - PubMed
    1. Krinsley JS. Association between hyperglycemia and increased hospital mortality in a heterogeneous population of critically ill patients. Mayo Clin Proc. 2003 Dec;78(12):1471–8. - PubMed
    1. Eberhardt F, Mehlhorn U, Larose K, De Vivie ER, Dhein S. Structural myocardial changes after coronary artery surgery. Eur J Clin Invest. 2000 Nov;30(11):938–46. - PubMed
    1. Semenza GL, Agani F, Feldser D, Iyer N, Kotch L, Laughner E, et al. Hypoxia, HIF-1, and the pathophysiology of common human diseases. Adv Exp Med Biol. 2000;475:123–30. - PubMed

Publication types

Substances