

Intraepithelial effector (CD3+)/regulatory (FoxP3+) T-cell ratio predicts a clinical outcome of human colon carcinoma
- PMID: 19577568
- PMCID: PMC2873775
- DOI: 10.1053/j.gastro.2009.06.053
Intraepithelial effector (CD3+)/regulatory (FoxP3+) T-cell ratio predicts a clinical outcome of human colon carcinoma
Abstract
Background & aims: Regulatory T cells (Tregs) express the forkhead box transcription factor (FoxP3) and suppress the antitumor immune response. We investigated whether the intratumoral densities of FoxP3(+) and effector CD3(+) lymphocytes are associated with prognosis of patients with colon cancer.
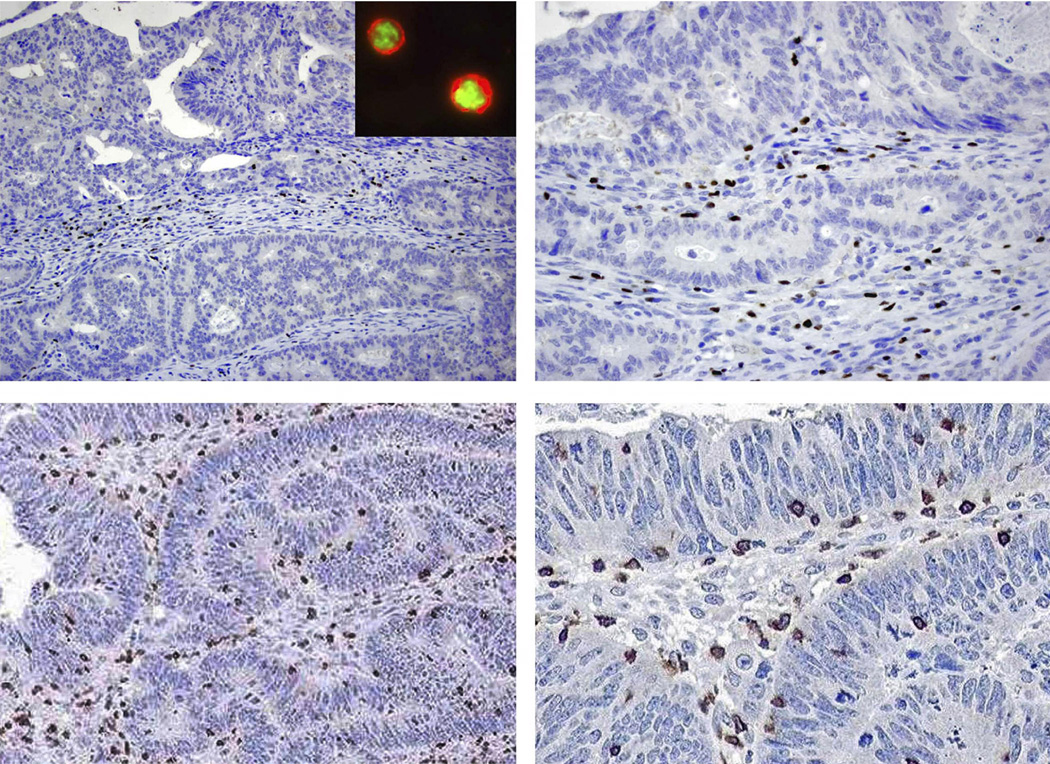
Methods: FoxP3 and CD3 expression and location were determined in stage II and III colon carcinomas (n = 160) and normal mucosa (n = 25) by immunohistochemistry; CD4 and FoxP3 were localized by dual immunofluorescence microscopy. T-cell markers were compared with pathological variables, DNA mismatch repair status, and patient survival using Cox proportional hazards models.
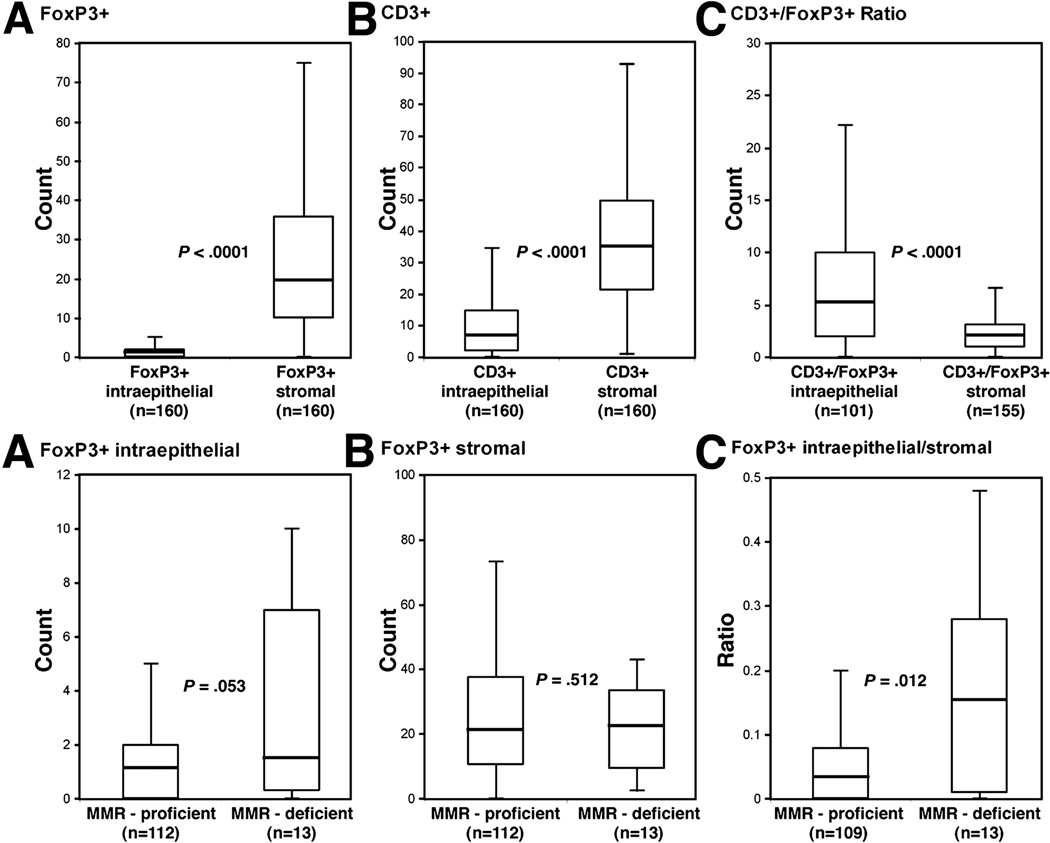
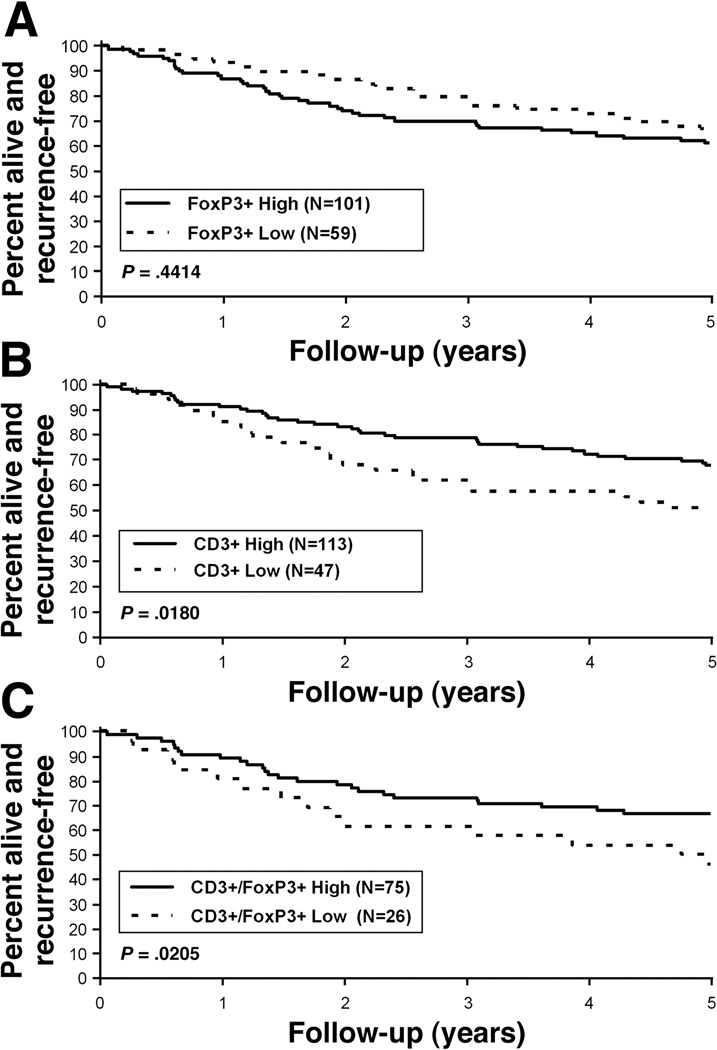
Results: FoxP3(+) and CD3(+) T-cell densities were increased in carcinomas compared with autologous normal mucosa (P < .0001). An increase in intraepithelial FoxP3(+) cells was associated with poor tumor differentiation (P = .038), female sex (P = .028), and advanced patient age (P = .042). FoxP3(+) cell density was not prognostic, yet patients with tumors with reduced intraepithelial CD3(+) T-cell densities had reduced disease-free survival (DFS) rates (hazard ratio [HR], 1.87 [95% confidence interval, 1.10-3.16]; P = .018). A low intraepithelial CD3(+)/FoxP3(+) cell ratio predicted reduced DFS (46.2% vs 66.7% survival at 5 years; HR, 2.17 [95% confidence interval, 1.11-4.23]; P = .0205). The prognostic impact of these markers was maintained when tumors were stratified by mismatch repair status. By multivariate analysis, a low CD3(+)/FoxP3(+) cell ratio (P= .0318) and low numbers of CD3(+) T cells (P = .0397) predicted shorter DFS times and were stronger prognostic variables than tumor stage or number of lymph node metastases.
Conclusions: A low intraepithelial CD3(+)/FoxP3(+) cell ratio and reduced numbers of CD3(+) T cells were associated with shorter patient survival time, indicating the importance of an effector to Treg cell ratio in colon cancer prognosis.
Conflict of interest statement
No conflicts of interest exist.
Figures
References
-
- Jemal A, Siegel R, Ward E, et al. Cancer statistics 2006. CA Cancer J Clin. 2006;56:106–130. - PubMed
-
- Zou W. Regulatory T cells, tumour immunity and immunotherapy. Nat Rev Immunol. 2006;6:295–307. - PubMed
-
- Shimizu J, Yamazaki S, Sakaguchi S. Induction of tumor immunity by removing CD25+CD4+ T cells: a common basis between tumor immunity and autoimmunity. J Immunol. 1999;163:5211–5218. - PubMed
-
- Ziegler SF. FOXP3: of mice and men. Annu Rev Immunol. 2006;24:209–226. - PubMed
Publication types
MeSH terms
Substances
Grants and funding
LinkOut - more resources
Full Text Sources
Other Literature Sources
Research Materials
