. 2009 Sep;20(9):1929-40.
doi: 10.1681/ASN.2008121286. Epub 2009 Jul 2.

Podocyte glutamatergic signaling contributes to the function of the glomerular filtration barrier

Affiliations

Podocyte glutamatergic signaling contributes to the function of the glomerular filtration barrier

Laura Giardino et al. J Am Soc Nephrol. 2009 Sep.

Abstract

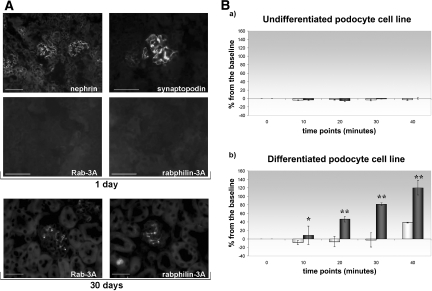
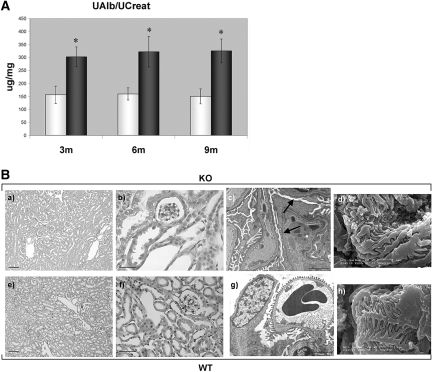
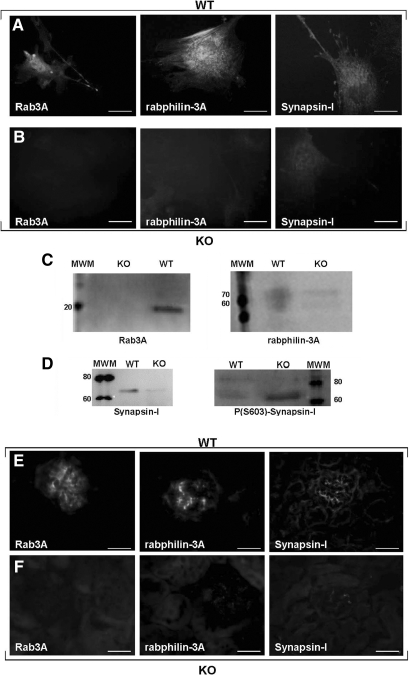
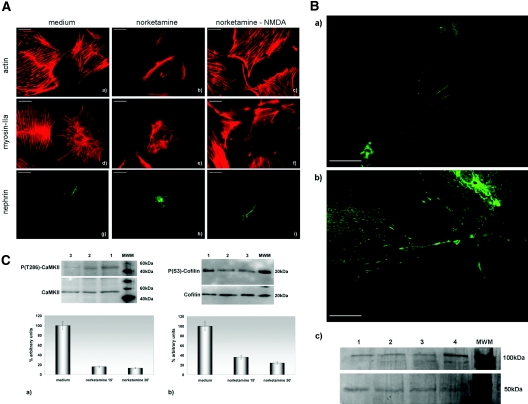
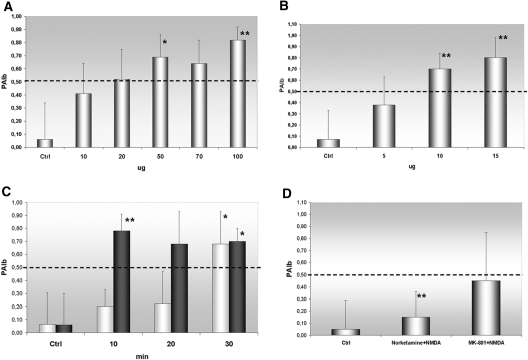
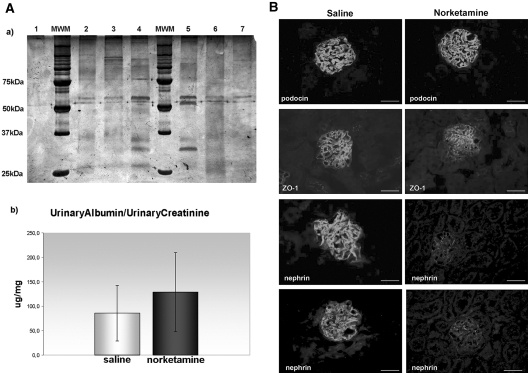
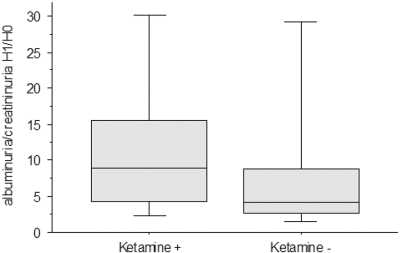
Podocytes possess the complete machinery for glutamatergic signaling, raising the possibility that neuron-like signaling contributes to glomerular function. To test this, we studied mice and cells lacking Rab3A, a small GTPase that regulates glutamate exocytosis. In addition, we blocked the glutamate ionotropic N-methyl-d-aspartate receptor (NMDAR) with specific antagonists. In mice, the absence of Rab3A and blockade of NMDAR both associated with an increased urinary albumin/creatinine ratio. In humans, NMDAR blockade, obtained by addition of ketamine to general anesthesia, also had an albuminuric effect. In vitro, Rab3A-null podocytes displayed a dysregulated release of glutamate with higher rates of spontaneous exocytosis, explained by a reduction in Rab3A effectors resulting in freedom of vesicles from the actin cytoskeleton. In addition, NMDAR antagonism led to profound cytoskeletal remodeling and redistribution of nephrin in cultured podocytes; the addition of the agonist NMDA reversed these changes. In summary, these results suggest that glutamatergic signaling driven by podocytes contributes to the integrity of the glomerular filtration barrier and that derangements in this signaling may lead to proteinuric renal diseases.


Figures

Figure 1.
Figure 1.
Glutamate exocytosis is a property of mature podocytes. (A) Developmental appearance of Rab3A and Rabphilin-3A. Compared with nephrin and synaptopodin, expressed in developing glomerular capillaries in newborn mice, Rab3A and rabphilin-3A stainings are completely negative (top, 1-d-old mouse). Both Rab3A and rabphilin-3A are positive in completely mature glomerular structures of a 30-d-old mouse (bottom). Indirect immunofluorescence: nephrin, bar = 100 μm; synaptopodin, Rab3A, and rabphilin-3A, bar = 50 μm; bottom, bar = 50 μm. (B) Glutamate exocytosis during podocyte differentiation. Glutamate was measured in the culture supernatant as expression of NADH generation at the beginning of the experiment (0) and every 10 min up to 40 min (time points on the x axis). Data come from three different sets of experiments, and results are expressed as percentage variation from the baseline (y axis, mean ± SD). (a) Spontaneous (□) and α-LTX–stimulated (■) glutamate exocytosis do not take place in undifferentiated podocytes grown at 33°C in presence of γ-IFN (the Concise Methods section). (b) Differentiated podocytes display spontaneous (□) glutamate release at 40 min. Nanomolar α-LTX addition causes glutamate release at increasing concentrations (■). As it occurs in neuronal cells,, regulated exocytosis is greater than spontaneous glutamate release (*P = 0.05; **P < 0.01). Magnifications: ×200 in A, top, nephrin; ×630 in A, top, synaptopodin, Rab3A, and rabphilin-3A; ×400 in A, bottom.
Figure 2.
Figure 2.
The renal phenotype of Rab3A-KO mice. (A) Macroalbuminuria is present in Rab3A-KO mice. UAlb/UCreat (μg/mg) was measured on 24-h urine samples in 27 Rab3A WT (□) and 27 KO animals (■). Data are means ± SD. Rab3A-WT (nine animals per age group, mean ± SD) show microalbuminuria, as expected according to the strain: 3m = 157 ± 33 μg/mg; 6m = 160 ± 23 μg/mg; 9m = 150 ± 29 μg/mg. Rab3A-KO (nine animals per age group, mean ± SD) display steady macroalbuminuria over time: 3m = 302 ± 38 μg/mg; 6m = 322 ± 59 μg/mg; 9m = 325 ± 46 μg/mg. *KO versus WT: P = 0.03. (B) Three-month-old Rab3A-KO and WT mice: Morphologic renal features. By light microscopy (KO: a and b; WT: e and f) kidneys display normal morphologic features (a and e: bars = 100 μm; b and f: bars = 50 μm). A glomerulus from a KO animal, observed by transmission electron microscopy (c; bar = 2 μm), shows segmental foot process effacement (arrows), whereas a glomerulus from a corresponding WT animal has normal foot processes (g; bar = 5 μm). Scanning electron microscopy allows the observation of disorganized podocyte foot process arrangement in a KO mouse (d; bar = 1 μm) and of the ordered structure of processes in a WT animal (h; bar = 1 μm). Magnifications: ×100 in B, a and e; ×400 in B, b and f; ×6000 in B, c and g; ×20000 in B, d and h.
Figure 3.
Figure 3.
Differences in the pattern of glutamate exocytosis by WT and KO podocytes. (A) Glutamate exocytosis in primary podocytes from WT and KO mice. Glutamate was measured in the culture supernatant as expression of NADH generation at the beginning of the experiment (0) and every 10 min up to 40 min (time points on the x axis). Data come from three different sets of experiments, and results are expressed as percentage variation from the baseline (y axis, mean ± SD). (a) Spontaneous exocytosis in Rab3A-WT podocytes (□) is measurable at 40 min. Addition of α-LTX (■) produces glutamate exocytosis measurable at 10 min and increasing over time. (b) Rab3A-KO podocytes spontaneously demonstrate glutamate release (□) at 10 min but do not show any exocytosis when stimulated by α-LTX (■). (B) Vesicle recycling. WT and KO podocytes are loaded with the styryl dye FM1-43 at the beginning of the experiment, and vesicle recycling is followed by live microscopy. WT cells (top) do not take up the dye in 20-min observation. After addition of α-LTX, cells become and remain fluorescent. The dye instead spontaneously inserts on the membrane of KO cells (bottom), and fluorescence does not change with the addition of α-LTX. Bars = 100 μm. Magnification, ×200.
Figure 4.
Figure 4.
Rab3A effector molecules. (A through D) Rab3A effector molecules in cultured podocytes. Compared with WT cells (A), that along Rab3A express rabphilin-3A and Synapsin-I, KO podocytes (B) look negative for Rab3A and show a decreased expression of both the effectors rabphilin-3A and Synapsin-I. Indirect immunofluorescence, bars = 50 μm. (C and D) Western Blot analysis confirms the presence of Rab3A only in WT podocytes and the reduction of rabphilin-3A and Synapsin-I in KO podocytes. (D) Phosphorylated Synapsin-I is instead lower in WT than in KO cells. (E and F) Rab3A effector molecules in mouse glomeruli. WT glomeruli (E) express Rab3A and its effectors, whereas the absence of Rab3A in a KO mouse (F) is accompanied by reduced expression of rabphilin-3A and Synapsin-I. Indirect immunofluorescence, bars = 50 μm. Magnification, ×400.
Figure 5.
Figure 5.
NMDAR in vitro blockade. (A) Effects on the cytoskeleton and nephrin expression. (a, b, d, e, g, and h) Compared with cells incubated with medium (a, d, and g), application of the NMDAR antagonist norketamine hydrochloride produces remodeling of the actin (b) and myosin IIA (e) cytoskeleton and redistribution of nephrin (h), which disappears from cell processes. (c, f, and i) The addition, after the antagonist, of the agonist NMDA, abolishes almost completely the agonist's effects. Phalloidin-TRITC (a through c); indirect immunofluorescence (d through i); bars = 50 μm. (B) Effects on NMDAR1 expression. (a and b) Compared with cells incubated with medium (a), addition of norketamine hydrochloride (b) determines an increased expression of the NMDAR1. Indirect immunofluorescence, bars = 50 μm. (c) Cells incubated with medium (lanes 1 through 3) express less NMDAR1 (band of approximately 100 kD) than cells treated by norketamine hydrochloride (lane 4). The lower band of 50 kD represents tubulin (loading control). (C) Downstream effects of the NMDAR blockade. Compared with cells incubated with medium (a and b, lane 1), phosphorylated CaMKII (a) and phosphorylated cofilin (b) are reduced, as compared with total CaMKII and total cofilin, after 15 (lane 2) and 30 min (lane 3) of treatment with norketamine hydrochloride. The graphs show a densitometric representation of Western blot results obtained from three experiments, where the ratio of lane 1 is taken at the arbitrary value of 100. Magnification, ×400.
Figure 6.
Figure 6.
(A and B) Effects of NMDAR blockade on PAlb. Application of growing dosages of norketamine hydrochloride (A) and MK-801 (B) on isolated glomeruli (the Concise Methods section) has a dosage-dependent effect on PAlb, compared with the application of medium alone (Ctrl). (C) The same concentrations used in the in vitro experiments produce effects at different times: 50 μM norketamine (□) changes PAlb when applied for at least 30 min, whereas 10 μM of the more potent MK-801 (■) becomes effective already after 10 min. (D) The addition of the antagonist NMDA at a dosage of 50 μM, and applied for 15 min, completely abolishes norketamine effects, whereas it only mildly reduces the action of MK-801. *P < 0.005 versus Ctrl; **P < 0.001 versus Ctrl.
Figure 7.
Figure 7.
NMDAR in vivo blockade. (A) Measurement of albuminuria. (a) Representative results from 3-mo-old animals, intraperitoneally injected with either saline (lanes 2, 3, 6, and 7) or norketamine hydrochloride (lanes 4 and 5) for 3 d. Twenty-four-hour urine samples were collected, run on an SDS-PAGE, and silver stained. Albumin bands (molecular weight approximately 60 kD) are increased, and other bands of lower molecular weight appear in the urine of norketamine-injected animals (lanes 4 and 5). Lane 1 is a negative control, made by running PBS alone. (b) UAlb/UCreat from urine samples of all animals (mean ± SD). Although not statistically significant, mean UAlb/UCreat is higher in the group injected with norketamine, compared with saline-injected controls. (B) Evaluation of podocyte-specific proteins. Comparison of podocyte proteins in glomeruli from a saline-injected (left) and a norketamine-injected (right) mouse. Podocin staining is identical in both samples, whereas a segmental reduction of ZO-1 and a global decrease of nephrin can be noticed in glomeruli of the norketamine-treated mouse, as compared with the staining of the saline-injected animal. Indirect immunofluorescence, bars = 50 μm. Magnification, ×400.
Figure 8.
Figure 8.
Effects of ketamine administration during general anesthesia. The graph illustrates the change after anesthesia (H1/H0) of the UAlb/UCreat values (mg/mmol) in patients who received ketamine (ketamine+) compared with those who did not (ketamine−). The horizontal lines inside the boxes represent median values, whereas bottom and top edges of the boxes represent the 25th and 75th percentiles and bottom and top whiskers reach the 10th and 90th percentiles, respectively.

Comment in

References

    1. Tryggvason K, Patrakka J, Wartiovaara J:Hereditary proteinuria syndromes and mechanisms of proteinuria. N Engl J Med 354: 1387–1401, 2006 - PubMed
    1. Putaala H, Soininen R, Kilpelainen P, Wartiovaara J, Tryggvason K:The murine nephrin gene is specifically expressed in kidney, brain and pancreas: Inactivation of the gene leads to massive proteinuria and neonatal death. Hum Mol Genet 10: 1–8, 2001 - PubMed
    1. Donoviel DB, Freed DD, Vogel H, Potter DG, Hawkins E, Barrish JP, Mathur BN, Turner CA, Geske R, Montgomery CA, Starbuck M, Brandt M, Gupta A, Ramirez-Solis R, Zambrowicz BP, Powell DR:Proteinuria and perinatal lethality in mice lacking NEPH1, a novel protein with homology to NEPHRIN. Mol Cell Biol 21: 4829–4836, 2001 - PMC - PubMed
    1. Ciani L, Patel A, Allen ND, ffrench-Constant C:Mice lacking the giant protocadherin mFAT1 exhibit renal slit junction abnormalities and a partially penetrant cyclopia and anophthalmia phenotype. Mol Cell Biol 23: 3575–3582, 2003 - PMC - PubMed
    1. Roselli S, Heidet L, Sich M, Henger A, Kretzler M, Gubler MC, Antignac C:Early glomerular filtration defect and severe renal disease in podocin-deficient mice. Mol Cell Biol 24: 550–560, 2004 - PMC - PubMed

MeSH terms