

Nitric oxide inhibits glomerular TGF-beta signaling via SMOC-1
- PMID: 19578009
- PMCID: PMC2736775
- DOI: 10.1681/ASN.2008060653
Nitric oxide inhibits glomerular TGF-beta signaling via SMOC-1
Abstract
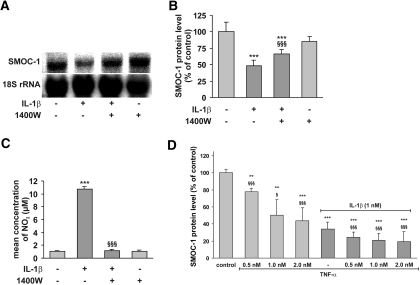
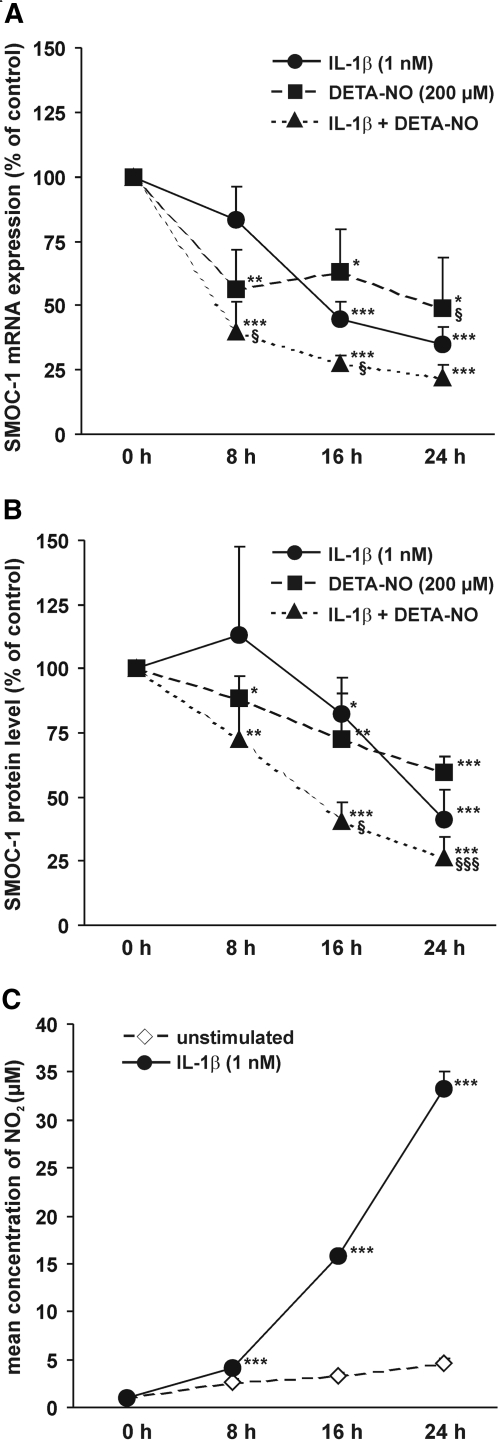
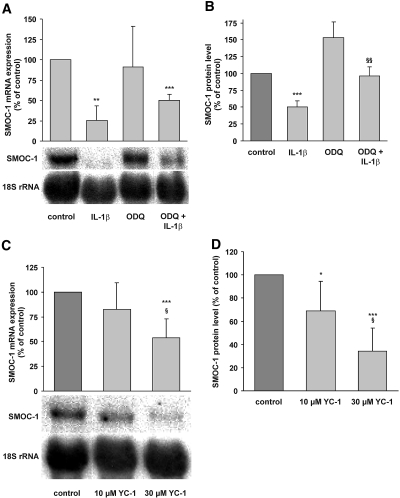
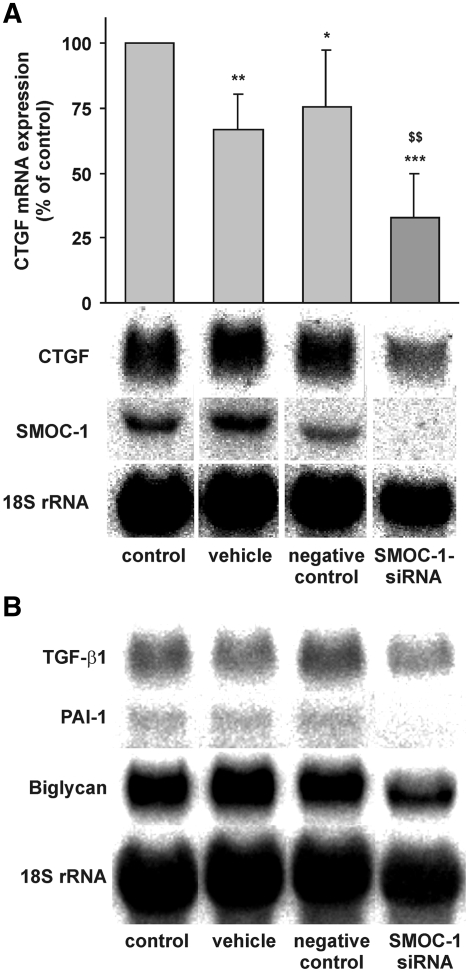
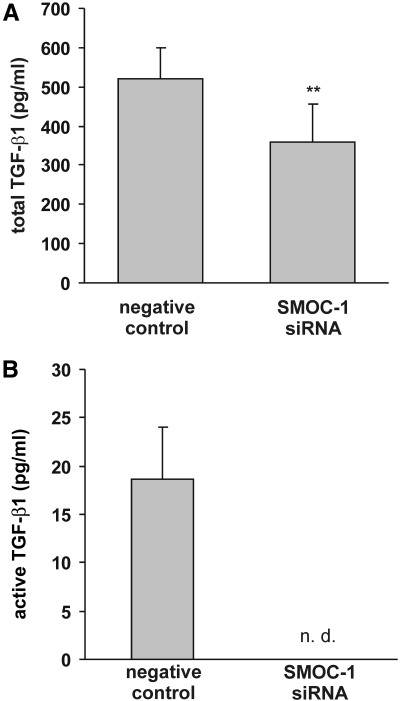
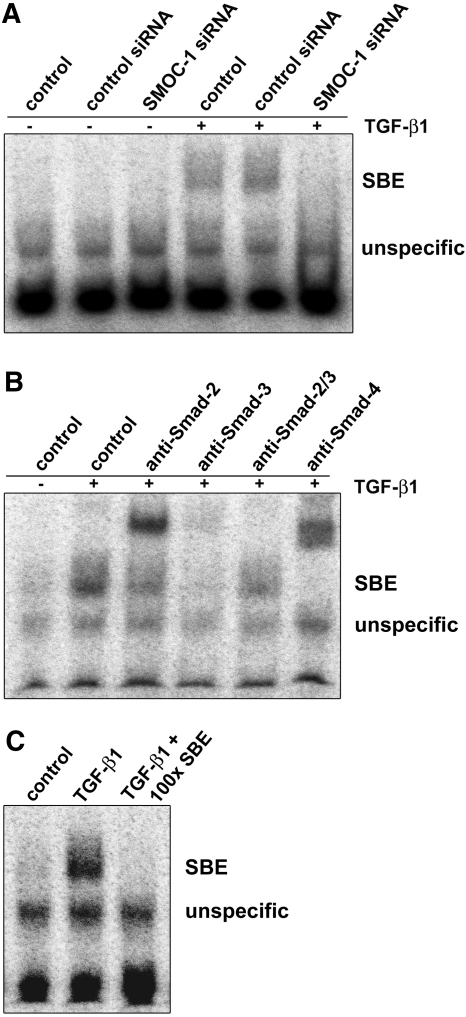
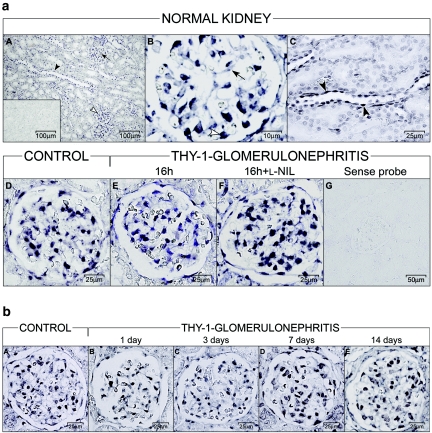
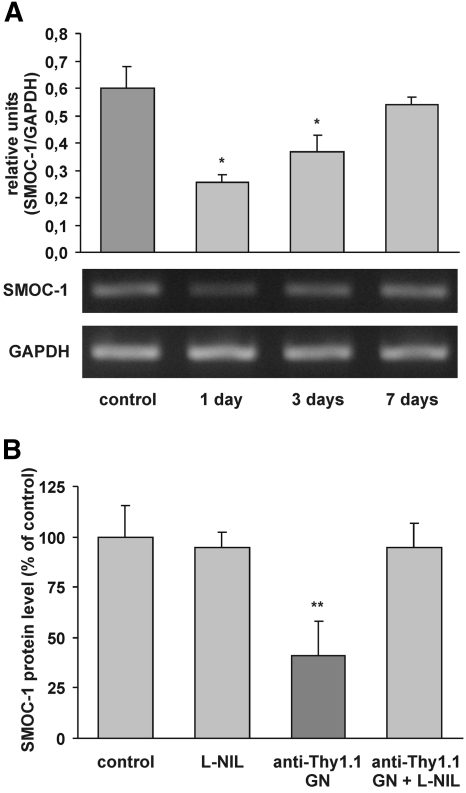
Cytokines and nitric oxide (NO) stimulate rat mesangial cells to synthesize and secrete inflammatory mediators. To understand better the signaling pathways that contribute to this response, we exposed rat mesangial cells to the prototypic inflammatory cytokine IL-1beta and analyzed the changes in the pattern of gene expression. IL-1beta downregulated the gene encoding the matricellular glycoprotein secreted modular calcium-binding protein 1 (SMOC-1) in mesangial cells. Inflammatory cytokines attenuated SMOC-1 mRNA and protein expression through endogenous production of NO, which activated the soluble guanylyl cyclase. Silencing SMOC-1 expression with small interfering RNA decreased the formation of TGF-beta, reduced SMAD binding to DNA, and decreased mRNA expression of genes regulated by TGF-beta. In a rat model of anti-Thy-1 glomerulonephritis, glomerular SMOC-1 mRNA and protein decreased and inducible NO synthase expression increased simultaneously. Treatment of nephritic rats with the inducible NO synthase-specific inhibitor l-N(6)-(1-iminoethyl)-lysine prevented SMOC-1 downregulation. In summary, these data suggest that NO attenuates SMOC-1 expression in acute glomerular inflammation, thereby limiting TGF-beta-mediated profibrotic signaling.
Figures
Similar articles
-
Expression and activity of soluble guanylate cyclase in injury and repair of anti-thy1 glomerulonephritis.Kidney Int. 2004 Dec;66(6):2224-36. doi: 10.1111/j.1523-1755.2004.66012.x. Kidney Int. 2004. PMID: 15569311
-
Downregulation of SPARC expression is mediated by nitric oxide in rat mesangial cells and during endotoxemia in the rat.J Am Soc Nephrol. 2000 Mar;11(3):468-476. doi: 10.1681/ASN.V113468. J Am Soc Nephrol. 2000. PMID: 10703670
-
Stimulation of soluble guanylate cyclase slows progression in anti-thy1-induced chronic glomerulosclerosis.Kidney Int. 2005 Jul;68(1):47-61. doi: 10.1111/j.1523-1755.2005.00380.x. Kidney Int. 2005. PMID: 15954895
-
Upregulation of group IB secreted phospholipase A(2) and its M-type receptor in rat ANTI-THY-1 glomerulonephritis.Kidney Int. 2006 Oct;70(7):1251-60. doi: 10.1038/sj.ki.5001664. Epub 2006 Aug 9. Kidney Int. 2006. PMID: 16900094
-
Downregulation of integrin-linked kinase mRNA expression by nitric oxide in rat glomerular mesangial cells.Life Sci. 2001 Nov 9;69(25-26):2945-55. doi: 10.1016/s0024-3205(01)01403-5. Life Sci. 2001. PMID: 11758822
Cited by
-
The heparin-binding activity of secreted modular calcium-binding protein 1 (SMOC-1) modulates its cell adhesion properties.PLoS One. 2013;8(2):e56839. doi: 10.1371/journal.pone.0056839. Epub 2013 Feb 21. PLoS One. 2013. PMID: 23437253 Free PMC article.
-
Prognostic Potential of Secreted Modular Calcium-Binding Protein 1 in Low-Grade Glioma.Front Mol Biosci. 2021 Nov 19;8:666623. doi: 10.3389/fmolb.2021.666623. eCollection 2021. Front Mol Biosci. 2021. PMID: 34869577 Free PMC article.
-
Secreted modular calcium-binding proteins in pathophysiological processes and embryonic development.Chin Med J (Engl). 2019 Oct 20;132(20):2476-2484. doi: 10.1097/CM9.0000000000000472. Chin Med J (Engl). 2019. PMID: 31613820 Free PMC article. Review.
-
Nebivolol, a β1-adrenergic blocker, protects from peritoneal membrane damage induced during peritoneal dialysis.Oncotarget. 2016 May 24;7(21):30133-46. doi: 10.18632/oncotarget.8780. Oncotarget. 2016. PMID: 27102153 Free PMC article.
-
Regulation of Cellular Redox Signaling by Matricellular Proteins in Vascular Biology, Immunology, and Cancer.Antioxid Redox Signal. 2017 Oct 20;27(12):874-911. doi: 10.1089/ars.2017.7140. Epub 2017 Sep 8. Antioxid Redox Signal. 2017. PMID: 28712304 Free PMC article.
References
-
- Cattell V:Nitric oxide and glomerulonephritis. Kidney Int 61: 816–821, 2002 - PubMed
-
- Baud L, Ardaillou R:Involvement of reactive oxygen species in kidney damage. Br Med Bull 49: 621–629, 1993 - PubMed
-
- Pfeilschifter J, Beck KF, Eberhardt W, Huwiler A:Changing gears in the course of glomerulonephritis by shifting superoxide to nitric oxide-dominated chemistry. Kidney Int 61: 809–815, 2002 - PubMed
-
- Radeke HH, Meier B, Topley N, Flöge J, Habermehl GG, Resch K:Interleukin 1-alpha and tumor necrosis factor-alpha induce oxygen radical production in mesangial cells. Kidney Int 37: 767–775, 1990 - PubMed
-
- Pfeilschifter J, Schwarzenbach H:Interleukin 1 and tumor necrosis factor stimulate cGMP formation in rat renal mesangial cells. FEBS Lett 273: 185–187, 1990 - PubMed
Publication types
MeSH terms
Substances
LinkOut - more resources
Full Text Sources
Other Literature Sources
Research Materials
