. 2009 Aug 28;284(35):23502-16.
doi: 10.1074/jbc.M109.012393. Epub 2009 Jul 3.

Identification and characterization of ambroxol as an enzyme enhancement agent for Gaucher disease

Affiliations

Identification and characterization of ambroxol as an enzyme enhancement agent for Gaucher disease

Gustavo H B Maegawa et al. J Biol Chem. .

Abstract

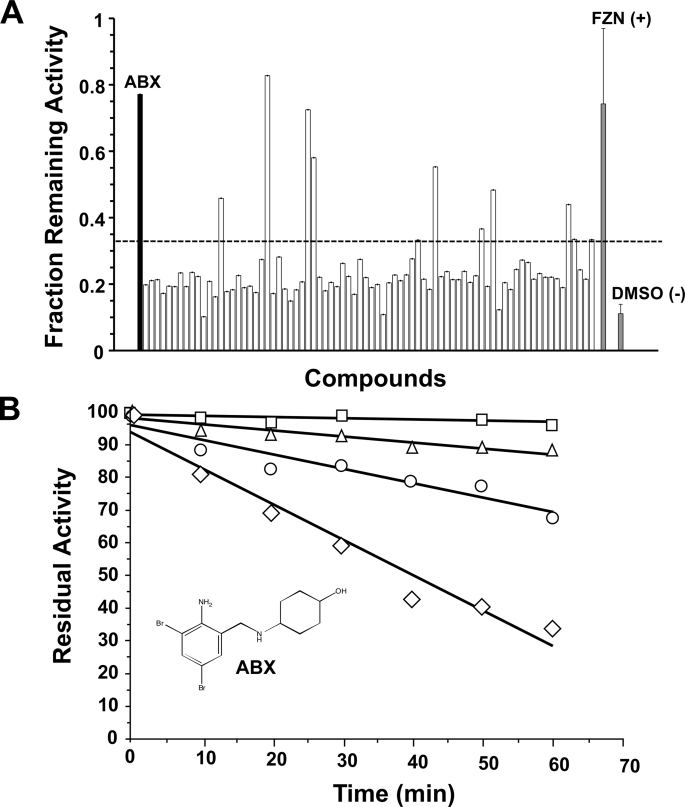
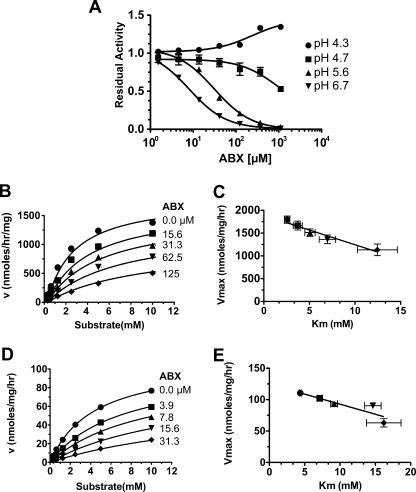
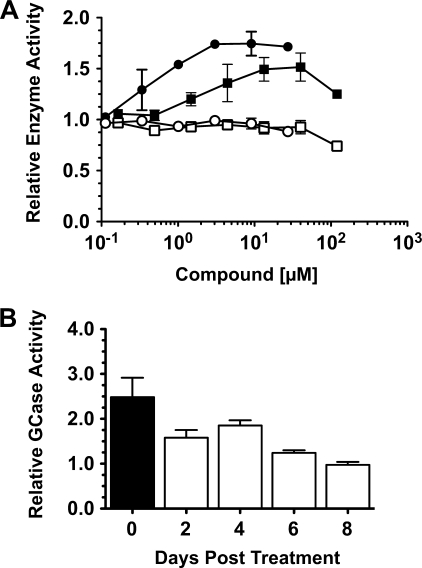
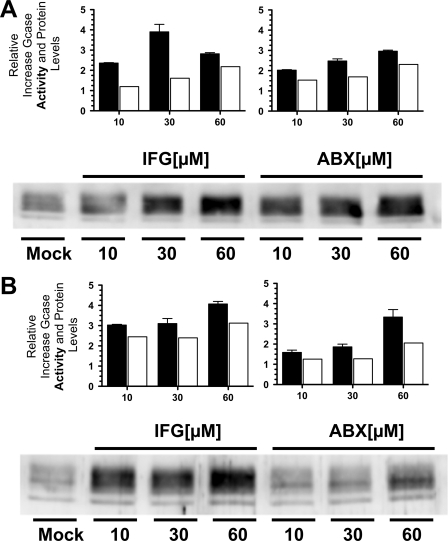
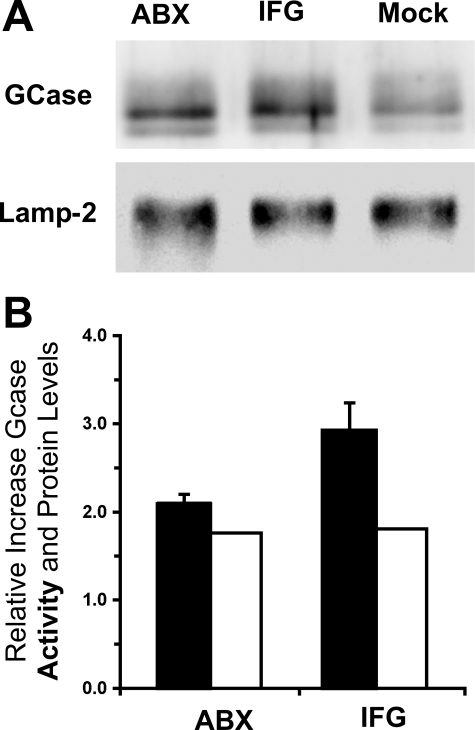
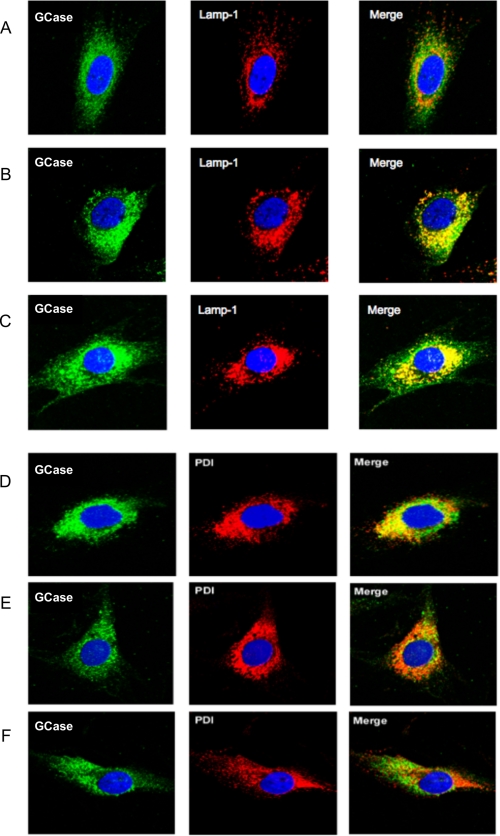
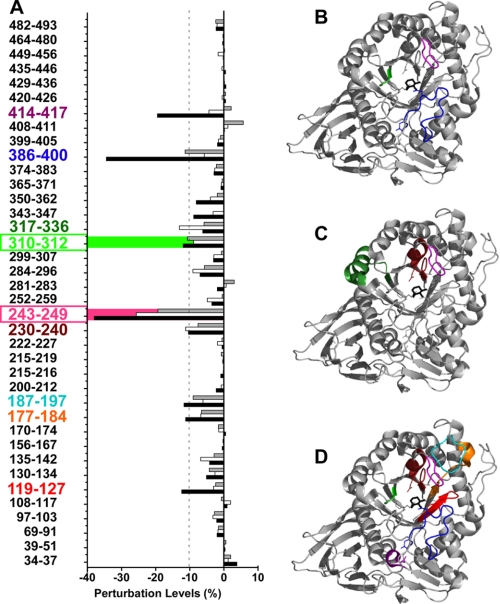
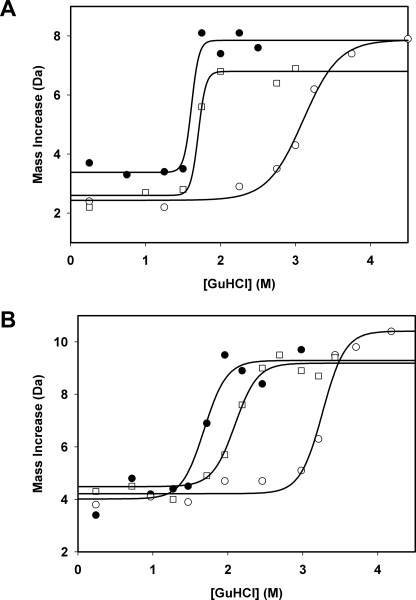
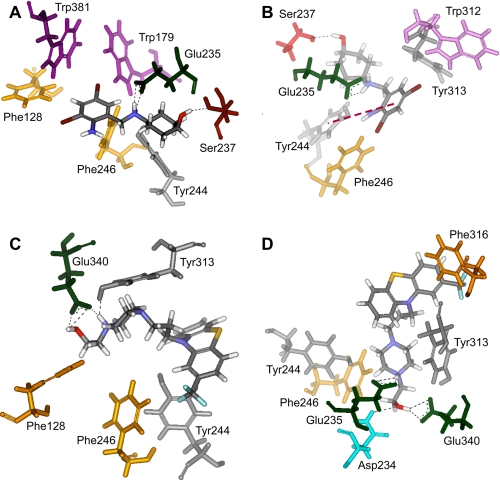
Gaucher disease (GD), the most prevalent lysosomal storage disease, is caused by a deficiency of glucocerebrosidase (GCase). The identification of small molecules acting as agents for enzyme enhancement therapy is an attractive approach for treating different forms of GD. A thermal denaturation assay utilizing wild type GCase was developed to screen a library of 1,040 Food and Drug Administration-approved drugs. Ambroxol (ABX), a drug used to treat airway mucus hypersecretion and hyaline membrane disease in newborns, was identified and found to be a pH-dependent, mixed-type inhibitor of GCase. Its inhibitory activity was maximal at neutral pH, found in the endoplasmic reticulum, and undetectable at the acidic pH of lysosomes. The pH dependence of ABX to bind and stabilize the enzyme was confirmed by monitoring the rate of hydrogen/deuterium exchange at increasing guanidine hydrochloride concentrations. ABX treatment significantly increased N370S and F213I mutant GCase activity and protein levels in GD fibroblasts. These increases were primarily confined to the lysosome-enriched fraction of treated cells, a finding confirmed by confocal immunofluorescence microscopy. Additionally, enhancement of GCase activity and a reduction in glucosylceramide storage was verified in ABX-treated GD lymphoblasts (N370S/N370S). Hydrogen/deuterium exchange mass spectrometry revealed that upon binding of ABX, amino acid segments 243-249, 310-312, and 386-400 near the active site of GCase are stabilized. Consistent with its mixed-type inhibition of GCase, modeling studies indicated that ABX interacts with both active and non-active site residues. Thus, ABX has the biochemical characteristics of a safe and effective enzyme enhancement therapy agent for the treatment of patients with the most common GD genotypes.


Figures

FIGURE 1.
FIGURE 1.
Identification of ABX as a potential PC for GD using an attenuation of GCase thermal denaturation assay. A, primary screening data are shown for 80 of the 1,040 chemical compounds (one 96-well plate), including ABX (black bar). Each plate contained 80 compounds from the library tested at 200 μm (open bars). One column (8 wells) contained only solvent (DMSO (−), negative control, gray bar), and another column FZN (FZN (+), positive control, gray bar). The y axis indicates the relative enzymatic activity after thermal denaturation compared with the corresponding well of an identical plate that was kept on ice. Those wells that retained a residual GCase activity of >3 S.D. (bars above the dotted line) of the mean of values from wells containing only DMSO were considered candidate PCs for GCase and were further investigated. B, secondary screening of ABX, with its molecular structure depicted, confirming that it stabilizes GCase toward heat inactivation in a dose-dependent manner (0 mm ABX, diamonds; 0.15 mm ABX, circles; 0.3 mm ABX, triangles; 1.2 mm ABX, squares). Data are expressed as the mean of duplicate assays.
FIGURE 2.
FIGURE 2.
Characterization of ABX as a pH-dependent, mixed inhibitor of GCase. A, inhibitory curves of increasing concentrations of ABX versus residual GCase activity using 0.8 mm MUbGlc at the indicated pH values. B and D, nonlinear regression analysis of GCase velocities at pH 5.6 (B) or pH 7.0 (D) versus increasing MUbGlc concentrations in the presence of the indicated concentrations of ABX (μm). This multivariate dataset (v, [I], [S]) was then fitted to the equation describing mixed type inhibition using GraphPad Prism version 5.0b (Table 1). C and E, plot of apparent Vmax versus apparent Km values at pH 5.6 (C) or pH 7.0 (E) demonstrates the validity of the mixed inhibitor model. The resulting kinetic constants are given in Table 1.
FIGURE 3.
FIGURE 3.
Determination of the levels of enhanced GCase activity and the length of its retention after treatment of N370S/N370S GD-1 fibroblast cell line with ABX. A, relative GCase (filled circles, IFG-treated; or squares, ABX-treated) and Hex (open circles, IFG-treated; or squares, ABX-treated) activities (y axis, 1 = no change from untreated cells) of cells treated with various concentrations of each drug (x axis). B, GD-1 cells were grown in media containing 60 μm ABX for 5 days (black rectangle) and then in normal media for the 2–8-day chase (open rectangles), and the relative GCase activity was determined. Bars represent S.E.
FIGURE 4.
FIGURE 4.
Comparison of the levels of enhanced GCase activity and protein in GD-1 and GD-2/3 fibroblasts treated with either ABX or IFG. A, N370S/N370S GD-1 fibroblasts treated with IFG (left panels) or ABX (right panels). B, F213I/L444P GD-2/3 fibroblasts treated with IFG (left panels) or ABX (right panels). In both N370S and F213I mutant cell lines, ABX generated comparable levels of enhancements of both GCase enzyme activity (black rectangles) and protein levels (open rectangles), derived from densitometry scans of the Western blot below the graphs, to those obtained at equivalent concentrations of IFG. In the Western blot panels, Mock represents the untreated cell lines. Bars represent S.E.
FIGURE 5.
FIGURE 5.
Enhancement of both GCase activity and protein levels in an enriched lysosomal fraction isolated from GD-1 fibroblasts (N370S/N370S) after treatment with either ABX or IFG. A, Western blot of GCase protein in the lysosomes from cells treated with either 60 μm ABX (left lane) or 30 μm IFG (middle lane) or untreated cells (Mock, right lane). A Western blot for lysosomal Lamp-2 is shown as a loading control. B, relative increases of GCase activity (black rectangles) and protein (densitometry scans of A, open rectangles) are represented in the histogram. Bars represent S.E.
FIGURE 6.
FIGURE 6.
Changes in the intracellular localization of N370S/N370S GCase after treatment of GD-1 fibroblasts with either ABX or IFG. A and D, mock-treated cells were compared with cells treated with 40 μm ABX (B and E) or 30 μm IFG (C and F). Co-localization of signals (yellow in the Merge panels) for GCase (green in the GCase panels) and the lysosomal marker Lamp-1 (red in the Lamp-1 panels) was increased over mock-treated cells (A) in both ABX-treated (B) and IFG-treated cells (C). At the same time co-localization of signals from GCase and the ER-resident chaperone protein, PDI (red in the “PDIpanels), decreased after treatment with either ABX treatment (E) or IFG treatment (F), as compared with mock-treated cells (D). Cell nuclei were stained with 4′,6-diamidino-2-phenylindoledihydrochloride (blue).
FIGURE 7.
FIGURE 7.
Identification and mapping of the segments of GCase that are stabilized upon formation of the ABX, FZN, or IFG enzyme-ligand complex by H/D-Ex MS. A, slower rates of H/D-Ex represented by negative perturbations (x axis) indicate rigidification (stabilization) of the associated segments of the protein (y axis) (supplemental Table 1S). Bars (ABX, gray; FZN, open; and IFG, black) that exceed the dotted line are considered as indicative of a statistically significant change in the mobility of the associated segment of the protein. B–D, ribbon diagrams based on the crystal structure of IFG bound to GCase (Protein Data Bank code 2NSX) are color-coded to indicate areas of GCase identified in A that are stabilized by binding to ABX (B), FZN (C), or IFG (D); segments 119–127 (IFG; red); 177–184 (IFG; orange); 187–197 (IFG; cyan); 230–240 (IFG and FZN; burgundy); 243–249 (IFG, FZN, and ABX; pink); 310–312 (IFG, FZN, and ABX; green); 317–336 (FZN; dark green); 386–400 (IFG and ABX; blue); and 414–417 (IFG; purple).
FIGURE 8.
FIGURE 8.
Determination of the binding energies and dissociation constants at acidic or neutral pH of the GCase-ABX or -IFG complex by SUPREX. Representative SUPREX curves (one of two GCase peptides, 67–91, examined at 1 of 4 H/D-Ex points, 30 min) of the change in mass, due to deuteration (y axis), in the SUPREX experiment in the presence of increasing concentrations of GdnHCl (x axis) are shown. The denaturation curve in the absence of ligand (filled circles), in the presence of ABX (open squares), or IFG (open circles) at pH 5.5 (A) or pH 7.0 (B) are shown. The solid lines represent the best fit of the data from each SUPREX curve to a four-parameter sigmoidal equation using SigmaPlot.
FIGURE 9.
FIGURE 9.
Two most likely structures, based on their consistency with H/D-Ex and previous co-crystallization (GCase and IFG) data, of the GCase-ABX or -FZN complex, determined by the flexible docking methodology. A and B, two poses detailing the predicted interactions of ABX with GCase. Both poses predict hydrogen bonding with Glu-235 and Ser-237, indicated by dashed lines. A, there are hydrophobic interactions between the cyclohexane ring and Phe-246 and Tyr-244. B, orientation selected for clarity of the π-π interaction (red dashed line) predicted with the ABX molecule and Tyr-244 of GCase, as well as other hydrophobic interactions with residues Phe-246, Trp-312, and Tyr-313. C and D, two poses are shown of the interaction of FZN with GCase. C, FZN molecule has two hydrogen bonding interactions with GCase at residues Glu-340 and Tyr-313 (dashed lines). D, in another orientation, FZN is shown to interact with GCase via three hydrogen bonding interactions with Asp-234, Glu-235, and Glu-340 (dashed lines). C and D, residues Phe-246, Tyr-244, Phe-316, and even Tyr-313 may also generate hydrophobic interactions with FZN.

References

    1. Sidransky E., Ginns E. I. (1997) J. Med. Genet. 34,876–877 - PMC - PubMed
    1. Sidransky E. (1997) Adv. Pediatr. 44,73–107 - PubMed
    1. Zhao H., Grabowski G. A. (2002) Cell. Mol. Life Sci. 59,694–707 - PMC - PubMed
    1. Goker-Alpan O., Lopez G., Vithayathil J., Davis J., Hallett M., Sidransky E. (2008) Arch. Neurol. 65,1353–1357 - PMC - PubMed
    1. Goker-Alpan O., Schiffmann R., LaMarca M. E., Nussbaum R. L., McInerney-Leo A., Sidransky E. (2004) J. Med. Genet. 41,937–940 - PMC - PubMed

Publication types

MeSH terms

Grants and funding