. 2010 Jan;51(1):132-9.
doi: 10.1194/jlr.M900255-JLR200.

Carvacrol, a component of thyme oil, activates PPARalpha and gamma and suppresses COX-2 expression

Affiliations

Carvacrol, a component of thyme oil, activates PPARalpha and gamma and suppresses COX-2 expression

Mariko Hotta et al. J Lipid Res. 2010 Jan.

Abstract

Cyclooxygenase-2 (COX-2), the rate-limiting enzyme in prostaglandin biosynthesis, plays a key role in inflammation and circulatory homeostasis. Peroxisome proliferator-activated receptors (PPARs) are ligand-dependent transcription factors belonging to the nuclear receptor superfamily and are involved in the control of COX-2 expression, and vice versa. Here, we show that COX-2 promoter activity was suppressed by essential oils derived from thyme, clove, rose, eucalyptus, fennel, and bergamot in cell-based transfection assays using bovine arterial endothelial cells. Moreover, from thyme oil, we identified carvacrol as a major component of the suppressor of COX-2 expression and an activator of PPARalpha and gamma. PPARgamma-dependent suppression of COX-2 promoter activity was observed in response to carvacrol treatment. In human macrophage-like U937 cells, carvacrol suppressed lipopolysaccharide-induced COX-2 mRNA and protein expression, suggesting that carvacrol regulates COX-2 expression through its agonistic effect on PPARgamma. These results may be important in understanding the antiinflammatory and antilifestyle-related disease properties of carvacrol.


Figures

Fig. 1.
Fig. 1.
Effects on COX-2 promoter activity by essential oils in BAEC. BAEC were transiently transfected with phPES2 (−327/+59) together with pCMX-hPPARg1 and pSV-β-gal as an internal control for the transfection. Following transfection, the cells were incubated for 5 h with no stimulant (control) or with each oil (0.01%) and LPS (1 μg/ml). The cells were harvested, lysed, and assayed for both luciferase and β-galactosidase activities. The results are represented as relative luciferase activities, which were normalized against the β-galactosidase standard and presented as the mean ± SD. *, P < 0.05, **, P < 0.01, compared with cells treated with 1 μg/ml LPS, by an unpaired t-test (n = 3).
Fig. 2.
Fig. 2.
Dose-dependent suppression of COX-2 promoter activity by thyme oil and the effects of chelerythrine on promoter activity. BAEC were transiently transfected with phPES2 (−327/+59), together with pCMX-hPPARg1, and pSV-β-gal as an internal control for the transfection. Following transfection, the cells were incubated for 5 h with thyme oil (0.002, 0.004, and 0.008%) and LPS (1 μg/ml) (A). In a second experiment, following transfection, the cells were incubated for 5 h with no stimulant (control) or were treated with LPS (1 μg/ml) in the presence or absence with chelerythrine (B). In both cases, the cells were harvested, lysed, and assayed for both luciferase and β-galactosidase activities. The results are represented as relative luciferase activities, which were normalized against the β-galactosidase standard and presented as the mean ± SD. *, P < 0.05, **, P < 0.01, compared with cells treated with 1 μg/ml LPS, by an unpaired t-test (n = 3).
Fig. 3.
Fig. 3.
Effect on activation of PPARs by essential oils. BAEC were transiently transfected with PPRE-luc together with GS-hPPARα (shaded column), pCMX-NUC1 (open column), or pCMX-hPPARg1 (solid column) and pSV-β-gal as an internal control for the transfection. Following transfection, the cells were incubated for 24 h with each essential oil (0.01%) (A). In the positive control experiment, the indicated concentration of selective PPAR activators such as Wy-14643 (α), GW501516 (β/δ), and pioglitazone (γ) were applied to the BAEC transiently transfected with PPRE-luc together with GS-hPPARα, pCMX-NUC1, or pCMX-hPPARg1, respectively (B). In both experiments, the cells were harvested, lysed, and assayed for both luciferase and β-galactosidase activities. The results are represented as relative luciferase activities, which were normalized against the β-galactosidase standard and presented as the mean ± SD. *, P < 0.05, **, P < 0.01, compared with cells treated with ethanol (control), by an unpaired t-test (n = 3).
Fig. 4.
Fig. 4.
Dose-dependent activation of PPARα and PPARγ by thyme oil. BAEC were transiently transfected with PPRE-luc together with GS-hPPARα (A) or pCMX-hPPARg1 (B) and pSV-β-gal as an internal control for the transfection. Following transfection, the cells were incubated for 24 h with thyme oil (0.002, 0.004, and 0.008%). The cells were harvested, lysed, and assayed for both luciferase and β-galactosidase activities. The results are represented as relative luciferase activities, which were normalized against the β-galactosidase standard and presented as the mean ± SD. *, P < 0.05, **, P < 0.01, compared with cells treated with ethanol (control), by an unpaired t-test (n = 3).
Fig. 5.
Fig. 5.
Major components of thyme oil and their structures. Thyme oil was analyzed by GC and GC-MS. Eleven major compounds, representing 96.80% (FID area percentage for GC) of the oil, were identified (A). The structures of some of the components and thymol are presented (B).
Fig. 6.
Fig. 6.
Effects on COX-2 promoter activity by components of thyme oil and thymol. BAEC were transiently transfected with phPES2 (−327/+59) together with pCMX-hPPARg1 and pSV-β-gal as an internal control for the transfection. Following transfection, the cells were incubated for 5 h with no stimulant (control), with LPS alone (1 μg/ml), or with LPS (1 μg/ml) and each component (1 mM). The cells were harvested, lysed, and assayed for both luciferase and β-galactosidase activities. The results are represented as relative luciferase activities, which were normalized against the β-galactosidase standard. *, P < 0.05, **, P < 0.01, compared with cells treated with 1 μg/ml LPS alone, by an unpaired t-test (n = 3).
Fig. 7.
Fig. 7.
PPARγ-dependent suppression of COX-2 promoter activity in response to carvacrol. BAEC were transiently transfected with phPES2 (−327/+59), along with either the human PPARγ expression vector, pCMX-hPPARg1 (open column), or the expression vector pCDNA3.1-GS alone (closed column) and pSV-β-gal as an internal control for the transfection. Following transfection, the cells were incubated for 5 h with no stimulant (control) or with carvacrol (100, 200, or 400 μM) and LPS (1 μg/ml). The cells were harvested, lysed, and assayed for both luciferase and β-galactosidase activities. The results are represented as relative luciferase activities, which were normalized against the β-galactosidase standard. *, P < 0.05, compared with open and closed columns, by an unpaired t-test (n = 3).
Fig. 8.
Fig. 8.
Activation of PPARα and PPARγ in response to carvacrol and thymol. BAEC were transiently transfected with PPRE-luc together with GS-hPPARα (A, C, E), or pCMX-hPPARg1 (B, D, F), and pSV-β-gal as an internal control for the transfection. Following transfection, the cells were incubated for 24 h with carvacrol, p-cymene, or thymol (100, 200, or 400 μM). The cells were harvested, lysed, and assayed for both luciferase and β-galactosidase activities. The results are represented as relative luciferase activities, which were normalized to the β-galactosidase standard. *, P < 0.05, **, P < 0.01, compared with cells treated with ethanol (control), by an unpaired t-test (n = 3).
Fig. 9.
Fig. 9.
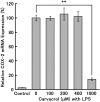
Suppression of COX-2 mRNA expression by carvacrol in macrophage-like differentiated U937 cells. Macrophage-like differentiated U937 cells were treated for 2 h with 10 μg/ml LPS in the presence or absence of 1 mM carvacrol. Isolated RNA was used for quantitative RT-PCR analysis. The amount of COX-2 mRNA was normalized to that of GAPDH mRNA, and the normalized amount of COX-2 mRNA induced by LPS was taken as 100%. The results represent the means ± SD of three separate dishes. **, P < 0.01, compared with cells treated with 10 μg/ml LPS, by an unpaired t-test (n = 3).
Fig. 10.
Fig. 10.
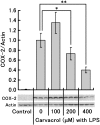
Suppression of COX-2 protein expression in response to carvacrol in macrophage-like differentiated U937 cells. Macrophage-like differentiated U937 cells were treated for 5 h with 10 μg/ml LPS in the presence or absence of the indicated concentrations of carvacrol. Cellular lysate proteins (5 μg/lane) were separated by 10% SDS-PAGE and transferred onto a polyvinylidene difluoride membrane. Immunoblots were probed with antibodies specific for COX-2 and actin. The expression level of COX-2 was normalized against that of actin, and the normalized amount of COX-2 protein induced by LPS was taken as 1.0. The results represent the mean ± SD of three separate dishes. *, P < 0.05, **, P < 0.01, compared with cells treated with 10 μg/ml LPS, by an unpaired t-test (n = 3).

References

    1. Smith W. L. 2008. Nutritionally essential fatty acids and biologically indispensable cyclooxygenases. Trends Biochem. Sci. 33: 27–33. - PubMed
    1. Simmons D. L., Botting R. M., Hla T. 2004. Cyclooxygenase isozymes: the biology of prostaglandin synthesis and inhibition. Pharmacol. Rev. 56: 387–437. - PubMed
    1. Koki A., Khan N. K., Woerner B. M., Dannenberg A. J., Olson L., Seibert K., Edwards D., Hardy M., Isakson P., Masferrer J. L. 2002. Cyclooxygenase-2 in human pathological disease. Adv. Exp. Med. Biol. 507: 177–184. - PubMed
    1. Dubois R. N., Abramson S. B., Crofford L., Gupta R. A., Simon L. S., Van De Putte L. B., Lipsky P. E. 1998. Cyclooxygenase in biology and disease. FASEB J. 12: 1063–1073. - PubMed
    1. Morham S. G., Langenbach R., Loftin C. D., Tiano H. F., Vouloumanos N., Jennette J. C., Mahler J. F., Kluckman K. D., Ledford A., Lee C. A., et al. 1995. Prostaglandin synthase 2 gene disruption causes severe renal pathology in the mouse. Cell. 83: 473–482. - PubMed

Publication types

MeSH terms