
Genome-wide association study identifies three loci associated with melanoma risk

D Timothy Bishop et al. Nat Genet. 2009 Aug.

Abstract

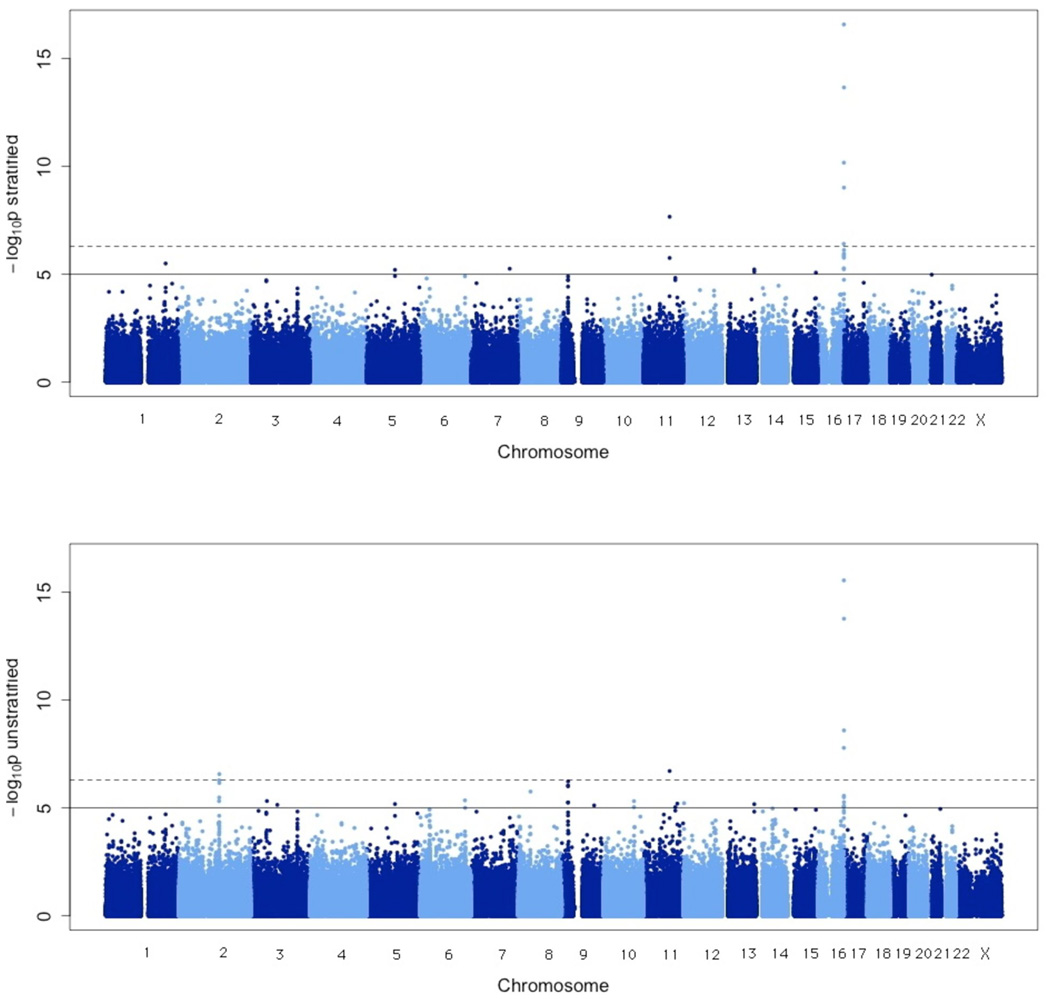
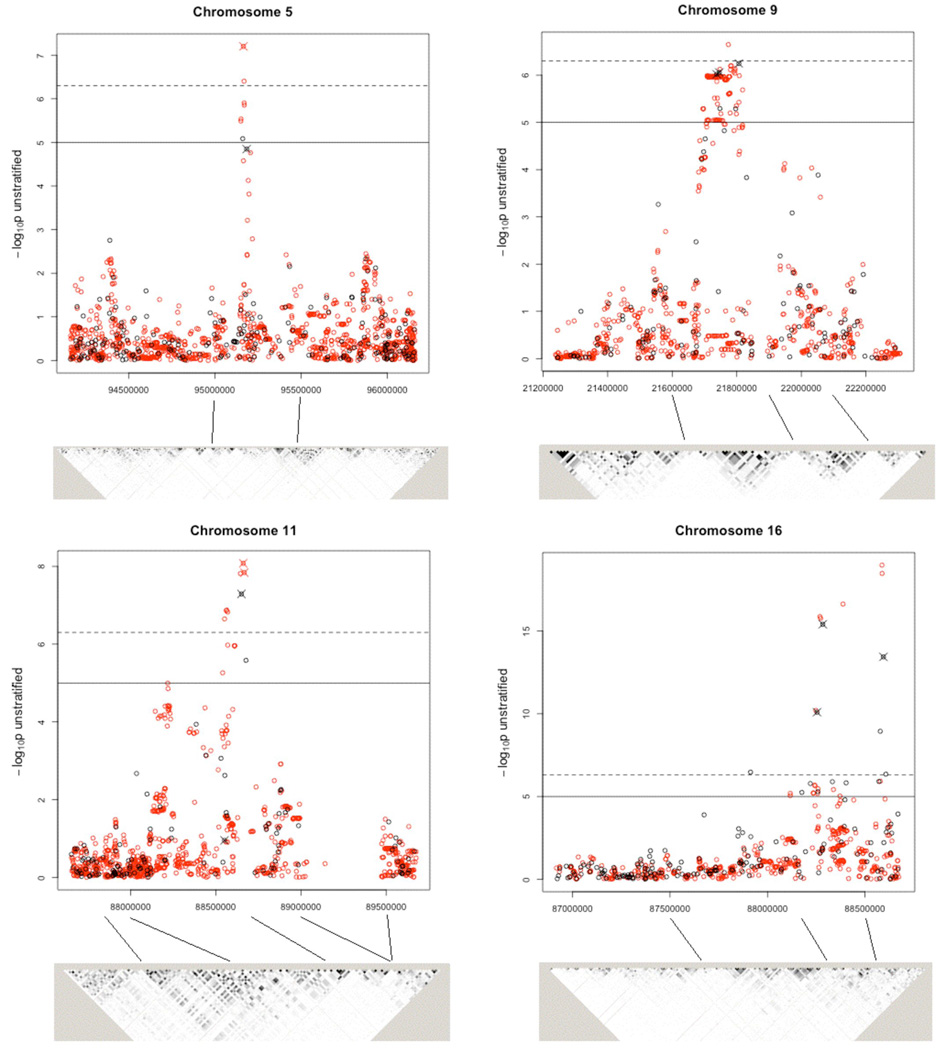
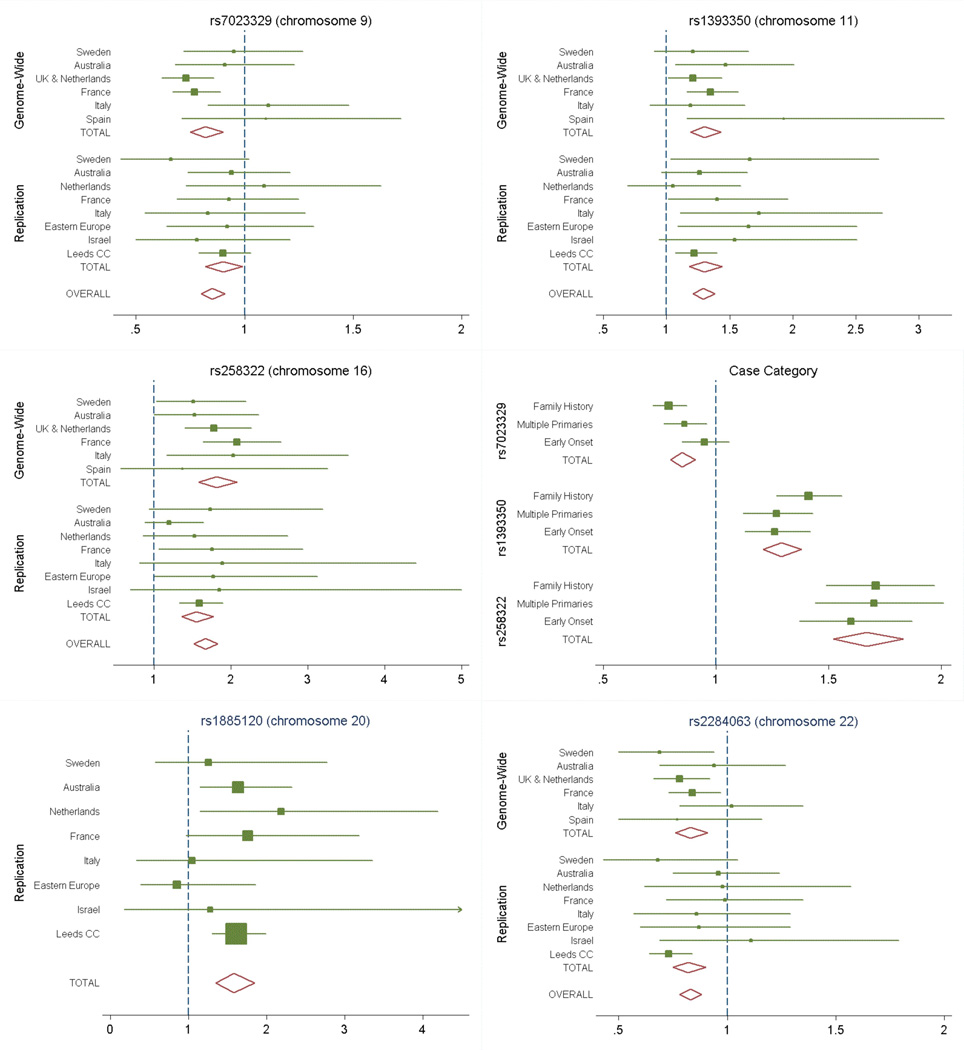
We report a genome-wide association study of melanoma conducted by the GenoMEL consortium based on 317K tagging SNPs for 1,650 selected cases and 4,336 controls, with replication in an additional two cohorts (1,149 selected cases and 964 controls from GenoMEL, and a population-based case-control study in Leeds of 1,163 cases and 903 controls). The genome-wide screen identified five loci with genotyped or imputed SNPs reaching P < 5 x 10(-7). Three of these loci were replicated: 16q24 encompassing MC1R (combined P = 2.54 x 10(-27) for rs258322), 11q14-q21 encompassing TYR (P = 2.41 x 10(-14) for rs1393350) and 9p21 adjacent to MTAP and flanking CDKN2A (P = 4.03 x 10(-7) for rs7023329). MC1R and TYR are associated with pigmentation, freckling and cutaneous sun sensitivity, well-recognized melanoma risk factors. Common variants within the 9p21 locus have not previously been associated with melanoma. Despite wide variation in allele frequency, these genetic variants show notable homogeneity of effect across populations of European ancestry living at different latitudes and show independent association to disease risk.


Figures

Figure 1
Figure 1
Results of Cochran-Armitage (CA) trend test for all SNPs passing quality control reported as −log10 p-values. The analysis stratified by geographic region is on the top with the unstratified analysis on the bottom (see Methods for details). The solid horizontal line indicates p-value of 10−5 and the dashed line indicates p-value of 5×10⁻⁷.
Figure 2
Figure 2
Stratified CA trend tests. The −log10 p-values are from the CA trend test stratified (by geographical region) for genotyped and imputed SNPs in candidate regions for follow-up. Genotyped SNPs are shown in black and imputed SNPs in red; those SNPs that were followed up in the replication stage are indicated by a cross. The solid horizontal line indicates a p-value of 10−5 and the dashed line indicates a p-value of 5×10⁻⁷. The grey scale plots indicate extent of pairwise linkage disequilibrium (measured by r2) between SNPs, estimated from our data using Haploview. Imputed data were not used for this. The darkest shading (black) indicates r2≥0.9, the next darkest 0.8≥ r2 > 0.9, etc. The position of the SNPs relative to the graph is indicated by the lines between the two.
Figure 3
Figure 3
Forest plot of associations by geography and case category. The forest plot of the estimated per-allele OR from the CA trend test across geographical regions and overall for (i) chromosome 9 (rs7023329, top left), (ii) chromosome 11 (rsl393350, top right), (iii) chromosome 16 (rs258322, middle left), (iv) by case-category for these three SNPs (middle right), (v) chromosome 20 (rsl885120, only genotyped in replication set, bottom left) and (vi) chromosome 22 (rs2284063, bottom right). Overall the associations are consistent across populations. The case categories show some limited variation for both chromosome 9 and chromosome 16 with family history and multiple primaries being associated with more extreme risk than early onset.

References

    1. Cannon-Albright LA, Bishop DT, Goldgar C, Skolnick MH. Genetic predisposition to cancer. Important Adv Oncol. 1991:39–55. - PubMed
    1. Bataille V, et al. Risk of cutaneous melanoma in relation to the numbers, types and sites of naevi: a case-control study. Br J Cancer. 1996;73:1605–1611. - PMC - PubMed
    1. Chang YM, et al. A pooled analysis of melanocytic nevus phenotype and the risk of cutaneous melanoma at different latitudes. Int J Cancer. 2009;124:420–428. - PMC - PubMed
    1. Hollenbeak CS, et al. Increased incidence of melanoma in renal transplantation recipients. Cancer. 2005;104:1962–1967. - PubMed
    1. Naldi L, et al. Cutaneous malignant melanoma in women. Phenotypic characteristics, sun exposure, and hormonal factors: a case-control study from Italy. Ann Epidemiol. 2005;15:545–550. - PubMed

Publication types

MeSH terms