. 2009 Jul;5(7):e1000496.
doi: 10.1371/journal.ppat.1000496. Epub 2009 Jul 3.

The dynamics of EBV shedding implicate a central role for epithelial cells in amplifying viral output

Affiliations

The dynamics of EBV shedding implicate a central role for epithelial cells in amplifying viral output

Vey Hadinoto et al. PLoS Pathog. 2009 Jul.

Abstract

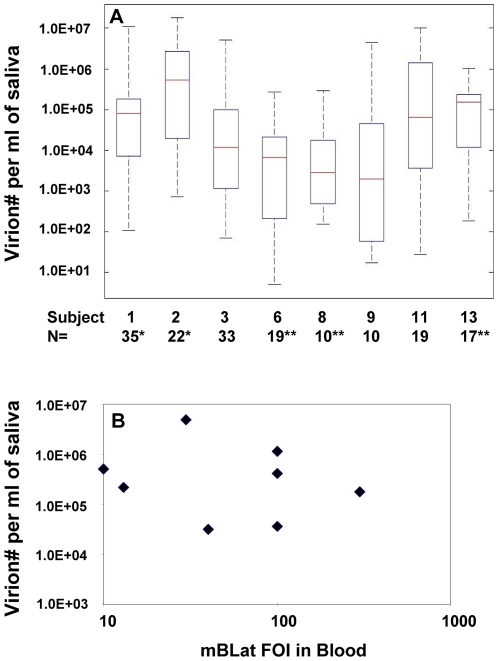
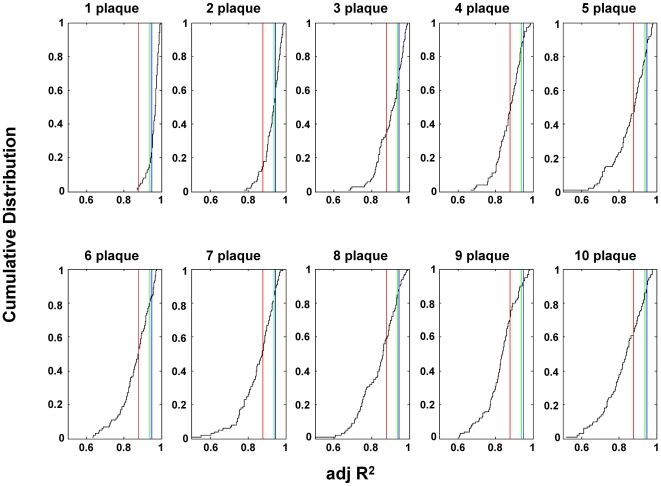
To develop more detailed models of EBV persistence we have studied the dynamics of virus shedding in healthy carriers. We demonstrate that EBV shedding into saliva is continuous and rapid such that the virus level is replaced in < or =2 minutes, the average time that a normal individual swallows. Thus, the mouth is not a reservoir of virus but a conduit through which a continuous flow stream of virus passes in saliva. Consequently, virus is being shed at a much higher rate than previously thought, a level too high to be accounted for by replication in B cells in Waldeyer's ring alone. Virus shedding is relatively stable over short periods (hours-days) but varies through 3.5 to 5.5 logs over longer periods, a degree of variation that also cannot be accounted for solely by replication in B cells. This variation means, contrary to what is generally believed, that the definition of high and low shedder is not so much a function of variation between individuals but within individuals over time. The dynamics of shedding describe a process governing virus production that is occurring independently < or =3 times at any moment. This process grows exponentially and is then randomly terminated. We propose that these dynamics are best explained by a model where single B cells sporadically release virus that infects anywhere from 1 to 5 epithelial cells. This infection spreads at a constant exponential rate and is terminated randomly, resulting in infected plaques of epithelial cells ranging in size from 1 to 10(5) cells. At any one time there are a very small number (< or =3) of plaques. We suggest that the final size of these plaques is a function of the rate of infectious spread within the lymphoepithelium which may be governed by the structural complexity of the tissue but is ultimately limited by the immune response.


Conflict of interest statement

The authors have declared that no competing interests exist.

Figures

Figure 1
Figure 1. The level of virus in saliva is stable and cannot be eliminated by repeated washing.
Two subjects were asked to rinse repeatedly with 5 ml of fluid and the viral genome copy number in the rinses estimated by EBV specific DNA PCR for the W repeat sequence of the viral genome. Note that even after 8 sequential rinses a similar level of virus was detected. The calculation to the right is based on an average time between rinses of approximately 2 minutes and a final volume of saliva rinse of 5 ml.
Figure 2
Figure 2. Virus shedding is stable over hours and days.
The bars represent the levels of viral DNA found in saliva at the times indicated. For details see Legend to Figure 1. N.B. For the data in the lower right panel single samples were taken on day 1 and 2 but two samples taken on days 3 and 8, one in the morning(am) and one in the evening (pm).
Figure 3
Figure 3. Virus shedding but not levels of infected cells vary by 4 to 5 logs over the course of months/years.
The amount of virus shed in saliva and the frequency of latently infected mBLat in the blood were measured concomitantly in three individuals over the course of 500 days. Note that virus shedding varies over 4 to 5 logs whereas the frequency of mBLat varies by less than a single log.
Figure 4
Figure 4. Cumulative distribution function (CDF) for the shedding data.
(A) The log10 values for the shedding data in Figure 3 are plotted cumulatively from lowest to highest against the normalized number of data points. Each step up represents a data point. Thus the extreme left point on each graph represents the lowest value for which there is only one data point, the next step up represents the second lowest point and so on till the last most extreme right point represents the highest value and therefore includes, cumulatively, all of the data points. (B) Cumulative distribution function (CDF) for all the shedding data summarized in Figure 5A.
Figure 5
Figure 5. There is no such entity as a consistently high or low shedder of EBV and no correlation between the levels of shedding and the frequency of infected mBLat in the blood.
(A) Shows the range of virus shedding in 8 individuals over months/years. Note that shedding varies between 3.5 and 5.5 logs. Red bars = the median, black box = 25th and 75th percentile, dashed line = the range, N = the number of independent positive measurements. * - the number of asterisks indicates the number of time points when no virus shedding was detected. (B) Shows the mean values for the data shown in A. plotted versus the frequency of infected mBLat (FOI) in the peripheral blood for each subject.
Figure 6
Figure 6. Linear regression analysis of the data in Figure 4B.
The CDFs for the 8 subjects are plotted individually as data points rather than as steps with the best fit straight line from linear regression analysis. Slopes and adjusted R2 values are given in Table 2. Blue line = the best fit straight line from the linear regression analysis. Red circles = the data points; green circles = the residuals i.e. the difference between each data point and the value given by the line.
Figure 7
Figure 7. Adjusted R2 values for simulations of plaque.
A simulation was performed where infectious plaques were initiated randomly, allowed to grow exponentially and randomly sampled 25 times (see Text S1 and Figure S2). This data was then plotted as a CDF and the adjusted R2 estimated for the best fit straight line to the data. This process was repeated 100 times for each of the plaque numbers indicated and the resulting R2 values plotted as a CDF. The red line indicates the lowest (0.88), the green line the 7th lowest (0.94) and the blue line the median R2 for our 8 subjects (see Table 2).
Figure 8
Figure 8. The variation in virus shedding into saliva over time is consistently seen in clarified and DNase treated preparations.
Solid line = Saliva was pretreated with DNase to remove unencapsidated viral DNA. Broken line = Saliva was clarified by centrifugation and then treated with DNase. Data is shown for three different subjects (A–C).
Figure 9
Figure 9. Schematic representation of the proposed model from this study.
EBV infected mBLat that return to the Waldeyer's ring (tonsils and adenoids) undergo plasma cell differentiation and initiate viral replication. In a typical healthy carrier the number of such cells at any one time is ≤50 and therefore insufficient to account for either the absolute level or the variation in shedding that we have observed over time. Virus released from the plasma cells infects the epithelium of Waldeyer's ring where it forms a plaque containing anywhere from 1 to 105 infected epithelial cells thus amplifying the amount of shed virus. Variability in the final size and stability of these plaques accounts for the high levels and variability of virus shedding and is probably a function of the initial seed of infected epithelial cells, the epithelial structure, and the immune response. Virus from the plaque is continuously shed into the saliva for several days providing a continuous stream of virions in the saliva that is replaced≤every 1 to 2 minutes.

References

    1. Kieff E, Rickinson AB. Epstein-Barr Virus and Its Replication. In: Knipe DM, Howley PM, editors. Fields Virology. 5th ed. Philadelphia: Lippincott Williams & Wilkins; 2007. pp. 2654.
    1. Thorley-Lawson D. EBV persistence and latent infection in vivo. In: ES R, editor. Epstein-Barr Virus. 1st ed. Norfolk, England: Caister Academic Press; 2005. pp. 349.
    1. Thorley-Lawson DA. Epstein-Barr virus: exploiting the immune system. Nat Rev Immunol. 2001;1:75–82. - PubMed
    1. Hadinoto V, Shapiro M, Greenough TC, Sullivan JL, Luzuriaga K, et al. On the dynamics of acute EBV infection and the pathogenesis of infectious mononucleosis. Blood. 2008;111:1420–1427. - PMC - PubMed
    1. Rickinson AB, Kieff E. Epstein-Barr Virus. In: Knipe DM, Howley PM, editors. Fields Virology. 5th ed. Philadelphia: Lippincott Williams & Wilkins; 2007. pp. 2700.

Publication types

Substances