. 2008 Jul 8:3:387-402.
doi: 10.4137/bmi.s692.

Effects of Cyclooxygenase Inhibitors on Apoptotic Neuroretinal Cells

Affiliations

Effects of Cyclooxygenase Inhibitors on Apoptotic Neuroretinal Cells

Anja-Kristina Brust et al. Biomark Insights. .

Abstract

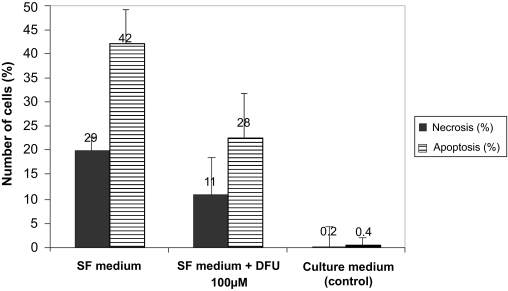
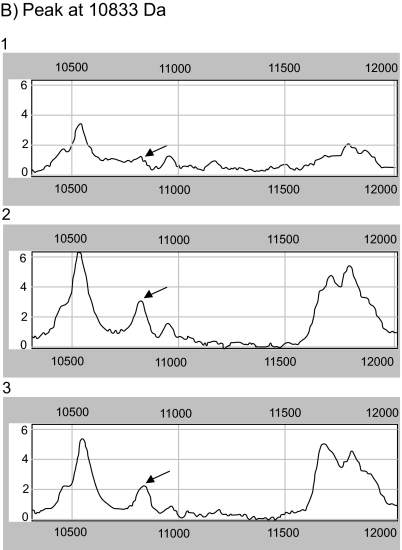
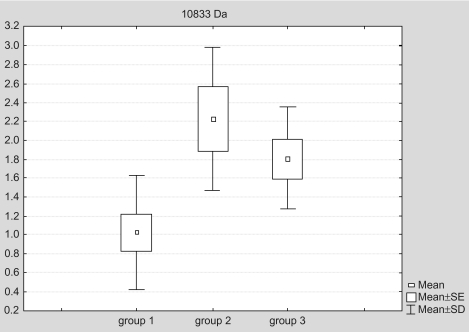
Glaucoma is characterized by a loss of retinal ganglion cells (RGC) which is associated with a decrease of visual function. Neuroprotective agents as a new therapeutic strategy could prevent the remaining neurons from apoptotic cell death. Previous studies have shown the involvement of the Cyclooxygenase (COX)-2 signalling in the apoptotic death of neurons. Herein we investigated the neuroprotective effect of COX-1/COX-2- and selective COX-2- inhibitors on apoptotic. R28, a neuroretinal cell line and determined the PGE(2) levels by ELISA. Furthermore we investigated differences in protein expression in the cells after exposure to elevated pressure compared to untreated cells by ProteinChip analysis.In addition, a protein profiling study of the cells after exposure to elevated pressure was performed. The protein expression profiles were measured by SELDI-TOF (Surface Enhanced Laser Desorption/Ionization-time of flight) Protein Chips. The protein identification was performed by mass spectrometry (MS).It could be shown that COX-2 inhibition significantly prevented the cells from apoptosis and reduced the PGE(2) concentrations. Selective COX-2 inhibitors were significant more potent than non-selective inhibitors or COX-1 inhibitors. We found differently expressed protein patterns in neuroretinal cells cultured at atmospheric pressure compared to those cells exposed to elevated pressure with or without celecoxib respectively. We identified three biomarkers, ubiquitin, HSP10 and NDKB, which were differently expressed in the groups. However, our data indicates a distinct neuroprotective effect of COX-2 inhibition. The local treatment with selective COX-2 inhibitors might provide an innovative strategy of therapeutic intervention for glaucoma.


Figures

Figure 1
Figure 1
(A) Western blot analysis using polyclonal antibodies to COX-1 of cells treated with elevated pressure (112 mmHg). Temporal profiles of COX-1 expression are shown in the lanes: 1 = 0 h, 2 = 2 h, 3 = 6 h, 4 = 24 h, 5 = 48 h. Immunoreactivity did not change after the different time points. (B) Western blot analysis using polyclonal antibodies to COX-2 of cells treated with elevated pressure (112 mmHg). Temporal profiles of COX-2 expression are shown in the lanes: 1 = 0 h, 2 = 2 h, 3 = 6 h, 4 = 24 h, 5 = 48 h. Strong immunoreactivity for COX-2 was present after 48 h (lane 5); whereas COX-2 was undetectable in control cells (lane 1).
Figure 2
Figure 2
Representative phase contrast microscope images of cells that were incubated under different conditions for 48 h. (A) cells treated with culture medium containing 10% FCS, (B) cells treated with serum-free medium, (C) cells treated with serum-free medium containing DFU (100 μM). Column 1: phase contrast microscope images of cells under normal light conditions. Column 2: The red fluorescent images show the propidium iodide stained necrotic cells. Column 3: The green fluorescent images show the Annexin-V-stained apoptotic cells.
Figure 3
Figure 3
Number of apoptotic and necrotic neuroretinal cells after incubation under different conditions for 48 h. Cells treated with serum-free medium, serum-free medium containing DFU (100 μM) and culture medium containing 10% FCS. ▪ = necrotic cells in %, ⊟ = apoptotic cells in %. Total number of cells = 100% (SF medium and SF medium + DFU were significantly different from control cells treated with medium containing 10% FCS (P < 0.001 versus control)).
Figure 4
Figure 4
Effect of different COX-inhibitors at different concentrations dissolved in serum-free medium after 48 h treatment on apoptotic neuroretinal cells. All drugs revealed significant effects compared to control cells treated with serum-free medium only (P < 0.05 versus control). Where error bars are not shown, they were smaller than the symbol.
Figure 5
Figure 5
Effect of different COX-inhibitors at a concentration of 10 μM dissolved in serum-free medium after 48 h treatment on apoptotic neuroretinal cells. All drugs revealed significant effects compared to control cells treated with serum-free medium only (¥ = P < 0.001; * = P < 0.05 versus control). The neuroprotective effect of celecoxib was significantly different from all other drugs (P < 0.05 versus control). Where error bars are not shown, they were smaller than the symbol.
Figure 6
Figure 6
Effect of celecoxib and ASA after treatment with elevated pressure (112 mmHg) for 48 h on apoptotic neuroretinal cells. The cells were treated with celecoxib and ASA at different concentrations dissolved in culture medium containing 10% FCS. (celecoxib: P < 0.05 versus control; ASA: P > 0.05 versus control). Control cells were treated at atmospheric pressure within 48 h with culture medium containing 10% FCS only. Where error bars are not shown, they were smaller than the symbol.
Figure 7
Figure 7
(A) Expression of COX-2 in pressurized RGC in the presence or absence (control cells) of celecoxib (5 μM) after 48 h incubation period. When cells expressing COX-2 were treated with celecoxib (5 μM), there was no appreciable change in the expression of COX-2. (B) shows the PGE2 synthesis of the pressurized RGC in the presence (black bars) or absence (white bars) (control cells) of celecoxib (5 μM) after 0 h or 48 h incubation period. The PGE2 synthesis of the celecoxib (5 μM) treated RGC was at each time point lower compared to untreated cells. RGC treated with the selective COX-2 inhibitor celecoxib (5 μM) showed a clear decrease in the PGE2 concentration compared to untreated cells. After 48 hour incubation period (the same incubation period which was also used for the viability tests of the cells) the celecoxib treated RGC, showed an increase of the PGE2 synthesis around the factor 1.7 compared to the time point 0 h. In contrast in the same period of time the PGE2 concentrations of the untreated RGCs increased around the factor 4.6.
Figure 8
Figure 8
(A, B, C) SELDI-TOF patterns of cells treated at atmospheric pressure (1), cells after exposure to elevated pressure (2) and cells treated with celecoxib in a 5 μM concentration dissolved in culture medium at elevated pressure for 48 h (3), The sample containing 8 μg/1 μl were analyzed on different ProteinChip surfaces: a weak cation exchange surface (CM10) and a reversed-phase surface (H50). All Protein Chip Arrays were pretreated according to the standard protocols of the manufacturer. 2 μl of samples were applied on each ProteinChip position. After drying, 1 μl matrix solution (sinapic acid in 0.15% TFA (trifluoroacetic acid)/50% ACN (acetonitrile) ) was added twice. The ProteinChips were measured in a SELDI-TOF reader (PBSIIc, Ciphergen, Fremont, CA) with standardized laser conditions throughout the whole experiment. Spectra were normalized by total ion current (TIC). The graphs reveal the molecular weight (x-axis) vs the intensity (normalized ion current, y-axis). Each of the spectra groups above (1, 2, and 3) demonstrates the molecular weight of three different biomarkers at 8588, 10833, and 13766 Da.
Figure 8
Figure 8
(A, B, C) SELDI-TOF patterns of cells treated at atmospheric pressure (1), cells after exposure to elevated pressure (2) and cells treated with celecoxib in a 5 μM concentration dissolved in culture medium at elevated pressure for 48 h (3), The sample containing 8 μg/1 μl were analyzed on different ProteinChip surfaces: a weak cation exchange surface (CM10) and a reversed-phase surface (H50). All Protein Chip Arrays were pretreated according to the standard protocols of the manufacturer. 2 μl of samples were applied on each ProteinChip position. After drying, 1 μl matrix solution (sinapic acid in 0.15% TFA (trifluoroacetic acid)/50% ACN (acetonitrile) ) was added twice. The ProteinChips were measured in a SELDI-TOF reader (PBSIIc, Ciphergen, Fremont, CA) with standardized laser conditions throughout the whole experiment. Spectra were normalized by total ion current (TIC). The graphs reveal the molecular weight (x-axis) vs the intensity (normalized ion current, y-axis). Each of the spectra groups above (1, 2, and 3) demonstrates the molecular weight of three different biomarkers at 8588, 10833, and 13766 Da.
Figure 9
Figure 9
Canonical roots of the differently treated groups: 1 = cells at atmospheric pressure; 2 = cells at elevated pressure (112 mmHg); 3 = cells at elevated pressure (112 mmHg) and celecoxib (5 μM). The canonical roots were calculated in the multivariate analysis of discriminance. This graph shows the quality of separation between the groups. Each point in this plot corresponds to one single sample. The closer the points are within this graph, the more similar the protein patterns of the samples were. The graph reveals clearly a good separation between the samples treated with and without elevated pressure, but demonstrates also a significant effect between the cells treated with celecoxib or not.
Figure 10
Figure 10
Expression of the biomarker at 10833 (mean ± SE) is plotted for the different groups: group 1 = control cells at atmospheric pressure; group 2 = cells at elevated pressure cultivated in culture medium without celecoxib; group 3 = cells at elevated pressure cultivated in culture medium containing celecoxib (5 μM).

Similar articles

Cited by

References

    1. Agar A, Shaojuan L, Agarwal N, Coroneo MT, Hill MA. Retinal ganglion cell line apoptosis induced by hydrostatic pressure. . Brain Res. 2006;1086:191–200. - PubMed
    1. Bagetta G, Corasaniti MT, Paoletti AM, Berliocchi L, Nistico R, Giammarioli AM, Malorni W, Finazzi-Agro A. HIV-1 gp 120-induced apoptosis in the rat neocortex involves enhanced expression of cyclooxygenase type 2 (COX-2). . Biochem. Biophys. Res. Commun. 1998;244:819–24. - PubMed
    1. Bazan NG. The neuromessenger platelet-activating factor in plasticity and neurodegeneration. . Prog. Brain Res. 1998;118:281–91. - PubMed
    1. Bazan NG. COX-2 as a multifunctional neuronal modulator. . Nat. Med. 2001;7:414–5. - PubMed
    1. Cazevieille C, Muller A, Meynier F, Dutrait N, Bonne C. Protection by prostaglandins from glutamate toxicity in cortical neurons. . Neurochem. Int. 1994;24:395–408. - PubMed