. 2009 Jul 8;97(1):20-39.
doi: 10.1016/j.bpj.2009.03.061.

Optimal velocity and safety of discontinuous conduction through the heterogeneous Purkinje-ventricular junction

Affiliations

Optimal velocity and safety of discontinuous conduction through the heterogeneous Purkinje-ventricular junction

Oleg V Aslanidi et al. Biophys J. .

Abstract

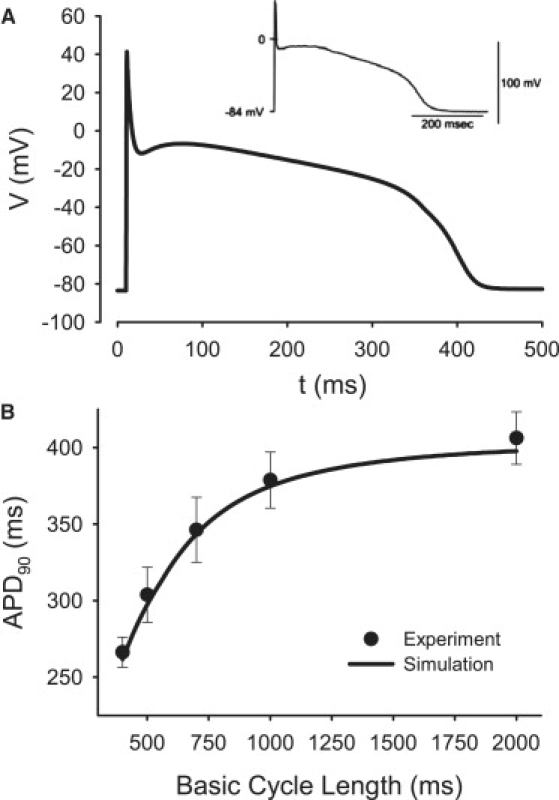
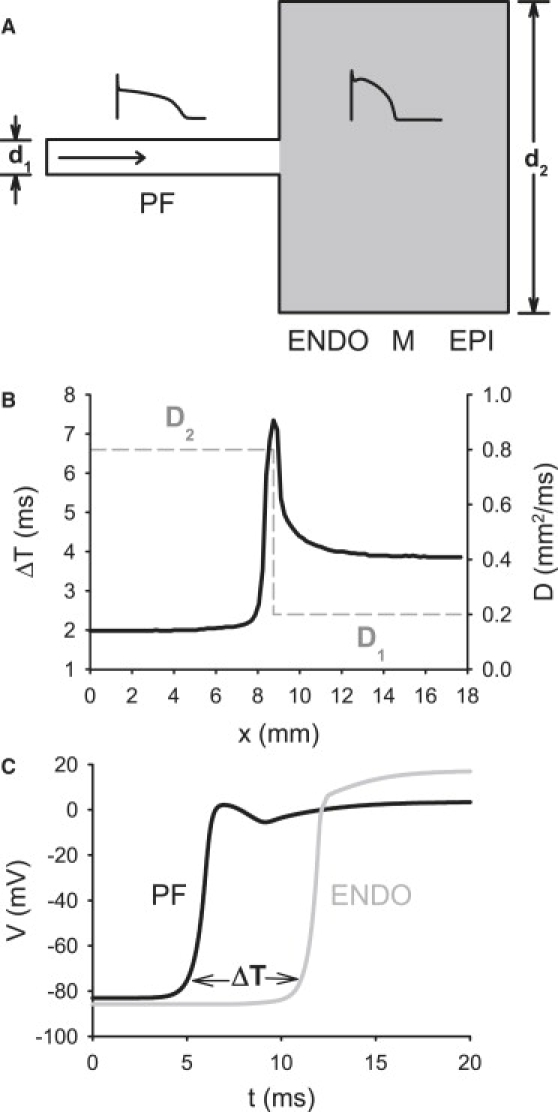
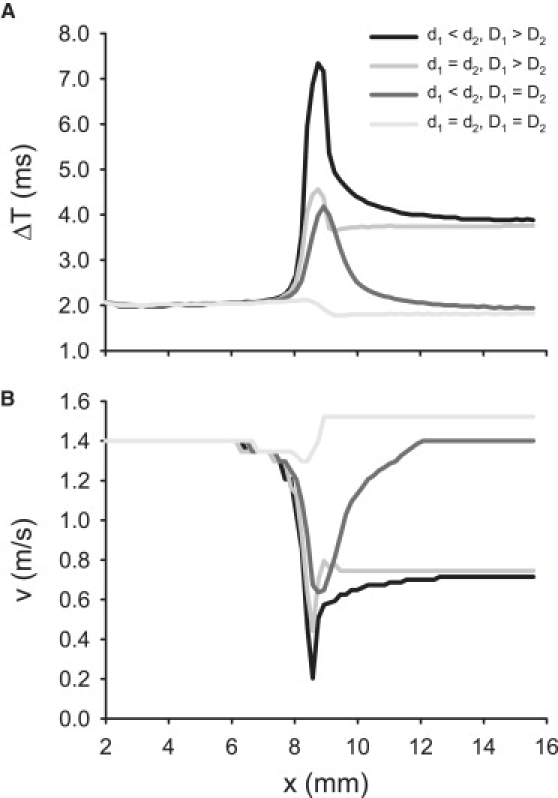
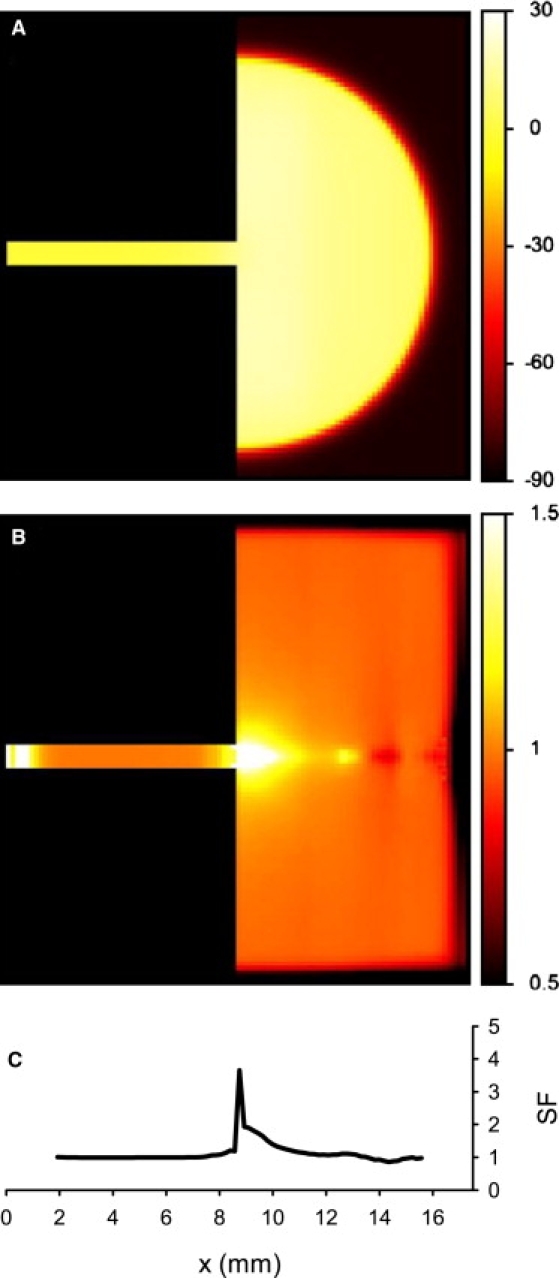
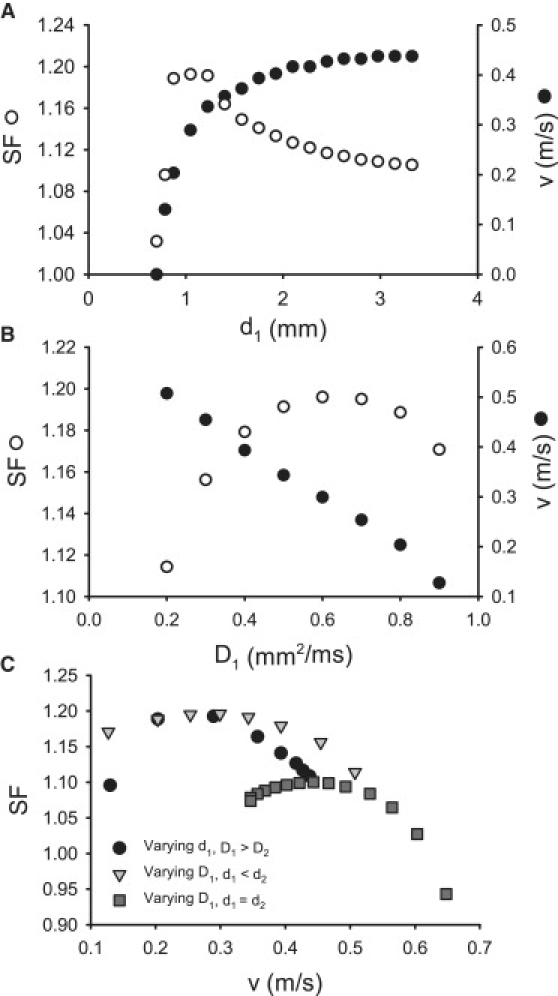
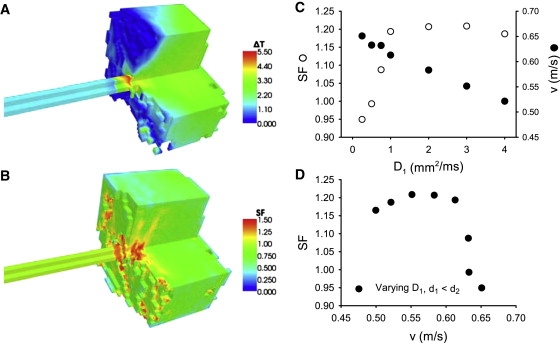
Slow and discontinuous wave conduction through nonuniform junctions in cardiac tissues is generally considered unsafe and proarrythmogenic. However, the relationships between tissue structure, wave conduction velocity, and safety at such junctions are unknown. We have developed a structurally and electrophysiologically detailed model of the canine Purkinje-ventricular junction (PVJ) and varied its heterogeneity parameters to determine such relationships. We show that neither very fast nor very slow conduction is safe, and there exists an optimal velocity that provides the maximum safety factor for conduction through the junction. The resultant conduction time delay across the PVJ is a natural consequence of the electrophysiological and morphological differences between the Purkinje fiber and ventricular tissue. The delay allows the PVJ to accumulate and pass sufficient charge to excite the adjacent ventricular tissue, but is not long enough for the source-to-load mismatch at the junction to be enhanced over time. The observed relationships between the conduction velocity and safety factor can provide new insights into optimal conditions for wave propagation through nonuniform junctions between various cardiac tissues.


Figures

Figure 1
Figure 1
Model of the late Na+ current, INa,L. Here, and in Figs. 2–6, simulated curves (lines) are compared to respective experimental data (circles) (24). (A) Steady-state inactivation curve. (B) Inactivation time constant. (C) INa,L during 500-ms voltage-clamp pulses to −70 to +30 mV from the holding potential of −80 mV. (D) I/V relationship. Vtest, test voltage.
Figure 2
Figure 2
Model of the L-type Ca2+ current, ICa,L compared with experimental data (21). (A) Steady-state activation and inactivation curves. (B) Fast and slow voltage-dependent inactivation time constants, τ1 and τ2. (C) ICa,L during 200-ms voltage-clamp pulses to −40 to +50 mV from a holding potential of −50 mV. (D) I/V relationship.
Figure 3
Figure 3
Model of the T-type Ca2+ current, ICa,T compared with experimental data (21). (A) Steady-state activation and inactivation curves. (B) ICa,T during 200-ms voltage-clamp pulses to −70 to +40 mV from a holding potential of −90 mV. (C) I/V relationship.
Figure 4
Figure 4
Model of the transient outward K+ current, Ito,1, compared to experimental data (21). (A) Steady-state activation and inactivation curves. (B) Fast and slow voltage-dependent inactivation time constants, τfast and τslow,; (C) Ito during 100-ms voltage-clamp pulses to −40 to +70 mV from a holding potential of −70 mV. (D) I/V relationship. Note that D shows the pure four-AP-sensitive current Ito,1, whereas C presents the sum of Ito,1 and the steady-state component of the outward K+ current, Ito,2.
Figure 5
Figure 5
Model of the fast delayed rectifier K+ current, IK,r. (A) IK,r simulated during 1000 ms voltage-clamp pulses to −40 to +50 mV from a holding potential of −50 mV, followed by a repolarizing 1000 ms pulse to −30 mV; B and (C) simulated I/V relationships for the step (B) and tail (C) currents compared to the respective experimental data (21).
Figure 6
Figure 6
Model of the slow delayed rectifier K+ current, IK,s, compared to the respective experimental data (21). (A) IK,s during 5000-ms voltage-clamp pulses to −40 to +60 mV from a holding potential of −60 mV, followed by a repolarizing 500-ms pulse to −40 mV. (B and C) I/V relationships for the step (B) and tail (C) currents.
Figure 7
Figure 7
Differences in ionic current densities between canine ventricular cell models (20) and our model for the canine PF cell. Currents are indicated by open vertical bars. Circles indicate experimentally measured values of the respective current densities in PF cells (21,24). ENDO, endocardial cell; M, midmyocardial cell; EPI, epicardial cell.
Figure 8
Figure 8
Differences in the dynamics of APs and ionic currents between the canine PF and ventricular cell models. Simulated AP morphologies and ionic current traces in the PF (left) and endocardial (right) cell models are shown. (Upper left inset) Experimental AP recording from a canine PF cell (25).
Figure 9
Figure 9
AP properties in the PF cell model. (A) Morphology compared with experimental data (25). (B) Restitution curve compared with experiment (27). APD90, AP duration at 90% repolarization.
Figure 10
Figure 10
Properties of the two-dimensional slice model of the PVJ. (A) Geometry of the PVJ. A single PF runs into a slab of ventricular tissue (gray) that consists of endocardial, midmyocardial, and epicardial layers (20). The width of the PF, d1, is much smaller than the width of the ventricular slab, d2. (Insets) AP morphologies in the PF (left) and ventricular (right) cells. The horizontal arrow shows the direction of AP propagation. (B) Plots of the nonuniform diffusion coefficient, D, and the AP conduction time delay, ΔT, at the PVJ, showing profiles of D (dashed line) and ΔT (solid line) along the horizontal spatial coordinate, x. ΔT is measured over a distance of 2 mm along the x-direction, as in experiments (29). (C) Time delay between APs recorded from the PF and ventricular tissues 2 mm apart across the PVJ.
Figure 11
Figure 11
Discontinuous AP conduction through the PVJ, represented by (A) time delay, ΔT, and (B) velocity, v. Plots show profiles of ΔT and v along the horizontal spatial coordinate x. Four cases are illustrated: the PVJ with nonuniformities in both tissue geometry and diffusion coefficient (d1 < d2, D1 > D2), tissue with a nonuniform diffusion coefficient (d1 = d2, D1 > D2), tissue with a nonuniform geometry (d1 < d2, D1 = D2), and tissue where both geometry and diffusion coefficient are uniform (d1 = d2, D1 = D2).
Figure 12
Figure 12
AP conduction in the 2D model of the PVJ, showing (A) spatial distribution of the transmembrane potential, V (mV), during successful AP conduction from the PF into the ventricular tissue, and (B) the resultant distribution of SF. Color keys for spatial distributions are at right. (C) Profile of the SF along the horizontal spatial coordinate, x.
Figure 13
Figure 13
Relationships between nonuniformities of the PVJ, the AP conduction velocity, v, and the safety factor, SF. (A and B) Dependence of v and SF on width of the PF, d1 (A), and on the diffusion coefficient of the PF, D1 (B). Both velocity and SF were measured at the PVJ, where v reached a local minimum. (C) Relationships between v and SF at the PVJ. Three cases are illustrated: v is changed by varying d1, v is changed by varying D1 at the PVJ (d1 < d2), and v is changed by varying D1 in a geometrically uniform tissue (d1 = d2). In all three cases, the dependence of the SF on v has a maximum.
Figure 14
Figure 14
AP conduction in the 3D model of the PVJ. (A) Spatial distribution of the time delay, ΔT, during successful AP conduction from the PF into the ventricular wedge. (B) Resultant distribution of the SF. Spatial distributions are color-coded as shown at right. Note that the visible discontinuity of the 3D patterns is due to the anisotropy of the ventricular tissue. (C) Dependence of v and SF on the diffusion coefficient of the PF, D1. Both velocity and SF were measured at the PVJ, where v reached a local minimum. (D) Relationship between v and SF at the PVJ. As in Fig. 12C, the dependence of the SF on v has a maximum.

Comment in

  • Cardiac muscle is not a uniform syncytium.
    Shaw RM, Rudy Y. Shaw RM, et al. Biophys J. 2010 Jun 16;98(12):3102-3; discussion 3104-5. doi: 10.1016/j.bpj.2010.03.030. Biophys J. 2010. PMID: 20550924 Free PMC article. No abstract available.

References

    1. Tyson J.J., Keener J.P. Singular perturbation theory of traveling waves in excitable media (a review) Physica D. 1988;32:327–361.
    1. Zipes D.P., Jalife J., editors. Cardiac Electrophysiology. From Cell to Bedside Sanders; Philadelphia: 2004.
    1. Shaw R.M., Rudy Y. Ionic mechanisms of propagation in cardiac tissue: roles of the sodium and L-type calcium currents during reduced excitability and decreased gap junction coupling. Circ. Res. 1997;81:727–741. - PubMed
    1. Goldstein S., Rall W. Changes of action potential shape and velocity for changing core conductor geometry. Biophys. J. 1974;14:731–757. - PMC - PubMed
    1. Joyner R.W., Veenstra R., Rawling D., Chorro A. Propagation through electrically coupled cells. Effects of a resistive barrier. Biophys. J. 1984;45:1017–1025. - PMC - PubMed

MeSH terms