. 2009 Jul 8;97(1):303-11.
doi: 10.1016/j.bpj.2009.05.003.

Thermodynamics of beta-sheet formation in polyglutamine

Affiliations

Thermodynamics of beta-sheet formation in polyglutamine

Andreas Vitalis et al. Biophys J. .

Abstract

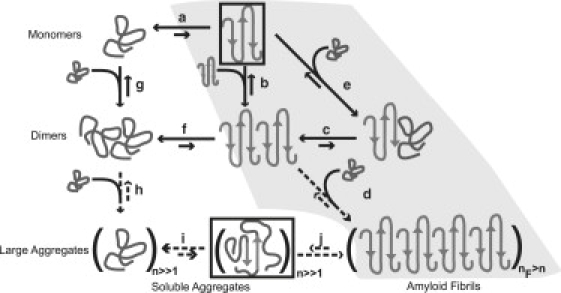
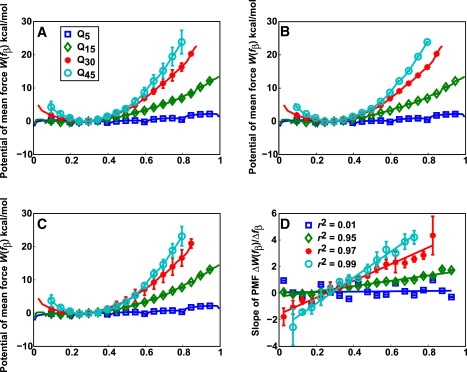
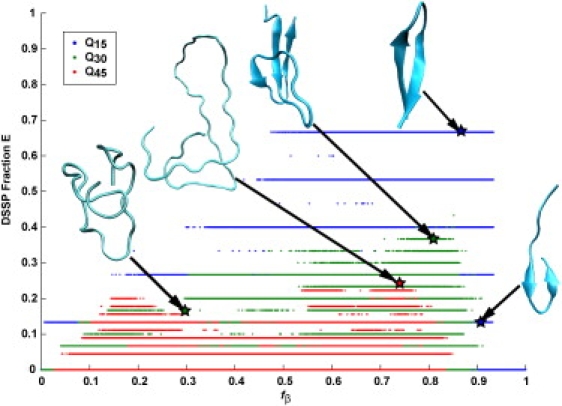
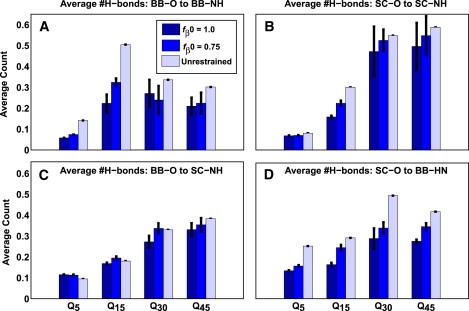
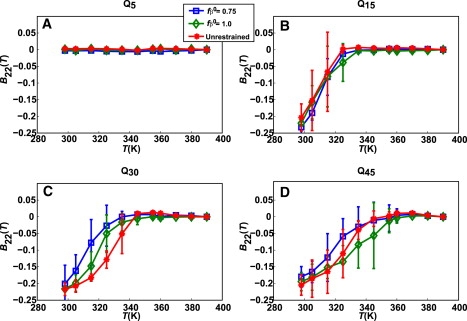
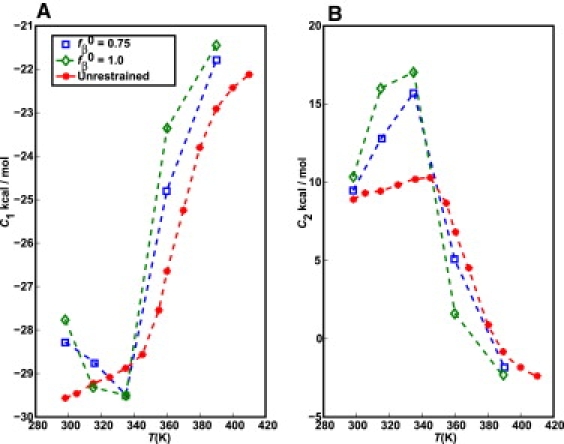
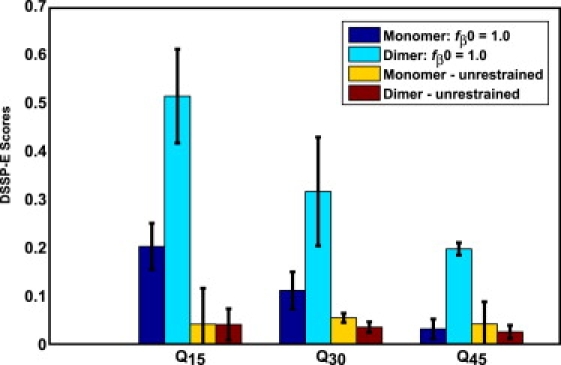
The role of beta-sheets in the early stages of protein aggregation, specifically amyloid formation, remains unclear. Interpretations of kinetic data have led to a specific model for the role of beta-sheets in polyglutamine aggregation. According to this model, monomeric polyglutamine, which is intrinsically disordered, goes through a rare conversion into an ordered, metastable, beta-sheeted state that nucleates aggregation. It has also been proposed that the probability of forming the critical nucleus, a specific beta-sheet conformation for the monomer, increases with increasing chain length. Here, we test this model using molecular simulations. We quantified free energy profiles in terms of beta-content for monomeric polyglutamine as a function of chain length. In accord with estimates from experimental data, the free energy penalties for forming beta-rich states are in the 10-20 kcal/mol range. However, the length dependence of these free energy penalties does not mirror interpretations of kinetic data. In addition, although homodimerization of disordered molecules is spontaneous, the imposition of conformational restraints on polyglutamine molecules does not enhance the spontaneity of intermolecular associations. Our data lead to the proposal that beta-sheet formation is an attribute of peptide-rich phases such as high molecular weight aggregates rather than monomers or oligomers.


Figures

Figure 1
Figure 1
Schematic of possible aggregation pathways for polyglutamine in vitro; n denotes the number of polyglutamine molecules within a disordered aggregate and nF denotes the number of polyglutamine molecules within an ordered amyloid fibril. The ordered amyloid fibril rich in β-sheets is shown in the bottom-right corner of the schematic. The gray-shaded region encompasses steps a, e, c, and d and depicts the homogeneous nucleation proposal of Chen et al. (11). We investigated the thermodynamics of step a, which indicates that the formation of ordered conformations is thermodynamically unfavorable. Monomeric polyglutamine prefers disordered, collapsed conformations, to the left of step a. Step b pertains to the thermodynamics of interactions between chains that have been restrained to adopt ordered conformations. Associativities of restrained chains—step b—are akin to the associativities of unrestrained chains—step g. However, the likelihood that chains will sample the associations shown in step b is very small, because this is tied to the equilibria in step a, which requires the population of the conformations with high β-content. Fig. 3 shows that this is highly unlikely. Similarly, step f shows that disordered dimers are thermodynamically favored to dimers with high β-contents in individual chains. This is the result of linkage to step a as discussed above. The aggregates achieved in step h are likely to be large (in terms of n) and exhibit spherical, “liquid-like” (31,32,34) organization of polyglutamine chains around each other. Step i depicts a slow conformational conversion of individual/small numbers of chains to β-sheets. This slow step is likely to lead to the creation of an ordered template for fibril formation via monomer or oligomer addition and elongation to yield the ordered amyloid fibril. Steps a, b, and g are anchored in the collection of data generated in this work and previous studies. However, the reversible associations depicted in step h and the conformational conversions depicted in step i are yet to be tested.
Figure 2
Figure 2
Correlation between fractional DSSP-E scores and fβ: The solid line is the line of best fit that quantifies the strength and direction of the linear correlation between fβ values and fractional DSSP-E scores. Parameters for the slope and intercept are shown in the inset. Structures that have high fractional DSSP-E scores also have high fβ values, although there is some scatter about the line of best fit. For ∼27% of the structures in the dataset, the fractional DSSP-E scores are zero. Although the fβ values for most of these structures are small (≤0.3), they span a finite range of fβ values.
Figure 3
Figure 3
Potentials of mean force (PMFs) for monomeric polyglutamine chains of different lengths. The profiles are plotted as a function of fβ, which is a reaction coordinate that measures β-content. (A) PMFs with standard errors, (B) with bootstrap errors, and (C) PMFs that result from using TI-WHAM with a coarse fβ schedule. Details are described in the Supporting Material. (D) Lines of best fit to the data for the derivatives of the PMFs shown in panel A. The insets show the Pearson correlation coefficients—r2—that diagnose the strength and direction of the hypothesis that the PMF derivatives (forces) are linear. The slopes and intercepts for the lines of best fit are as follows: Q5 (0.25, −0.05), Q15 (2.00, −0.27), Q30 (5.74, −1.38), and Q45 (9.5, −2.65). Slopes have units of kcal/mol-fβ and intercepts have units of kcal/mol.
Figure 4
Figure 4
Scatter plot of all recorded snapshots in all simulations for Q15, Q30, and Q45 correlating the fractional β-content according to DSSP with the values for fβ at 298 K. Dots of different colors correspond to chains of different length. Representative points are marked using stars and the corresponding structures are shown in cartoon representation. Graphics were generated using VMD (35). Note that the fractional β-content according to DSSP is an inherently discrete quantity for chains of finite length. Q5 is not shown since the chain is too short to have nonzero DSSP-E scores.
Figure 5
Figure 5
Average number of hydrogen bonds per acceptor oxygen atoms. Data are shown for hydrogen bonds around the backbone (A and C) and side-chain (B and D) acceptor oxygen atoms, respectively. BB denotes backbone and SC denotes side chains. Values are shown for T = 298 K and three different chain lengths (Q15, Q30, Q45) and restraint values. Hydrogen bonds were determined using the general definition introduced by Kabsch and Sander (24).
Figure 6
Figure 6
Plots of B22(T) as a function of temperature. Each panel shows B22(T) extracted from simulations with unrestrained chains and simulations where each chain in the simulation has a target restraint of fβ0 = 0.75 or fβ0 = 1.0.
Figure 7
Figure 7
Energy density C1 (A) and surface energy term C2 (B) for monomeric polyglutamine. Data were obtained for unrestrained polyglutamine and two other simulations with restraints on fβ. The quality of the fits underlying these data cannot be accurately assessed since they are fits to data from only three chain lengths (because we exclude Q5 excluded from analysis, since it is too short for a volumetric term to contribute).
Figure 8
Figure 8
Bar plots comparing the average fractional DSSP-E scores in simulations of monomeric polyglutamine to simulations of dimeric polyglutamine at 298 K. Data are shown for three chain lengths using data from simulations with unrestrained chains as well as data from simulations for fβ0 = 1.0.
Figure 9
Figure 9
Average number of hydrogen bonds per acceptor oxygen atoms. This plot is similar to Fig. 5 except that the hydrogen-bond statistics are shown for simulations with two molecules. Only intermolecular hydrogen bonds are shown. Q5 is excluded from this plot, since no intermolecular hydrogen bonds are detected in these simulations.

References

    1. Williams A.J., Paulson H.L. Polyglutamine neurodegeneration: protein misfolding revisited. Trends Neurosci. 2008;31:521–528. - PMC - PubMed
    1. Ross C.A. When more is less: pathogenesis of glutamine repeat neurodegenerative diseases. Neuron. 1995;15:493–496. - PubMed
    1. Ross C.A., Poirier M.A. Protein aggregation and neurodegenerative disease. Nat. Med. 2004;10:S10–S17. - PubMed
    1. Chen S.M., Berthelier V., Hamilton J.B., O'Nuallain B., Wetzel R. Amyloid-like features of polyglutamine aggregates and their assembly kinetics. Biochemistry. 2002;41:7391–7399. - PubMed
    1. Perutz M.F., Finch J.T., Berriman J., Lesk A. Amyloid fibers are water-filled nanotubes. Proc. Natl. Acad. Sci. USA. 2002;99:5591–5595. - PMC - PubMed

Publication types

LinkOut - more resources