. 2009 Sep;77(9):3791-806.
doi: 10.1128/IAI.00284-09. Epub 2009 Jul 6.

Gr1+ cells control growth of YopM-negative yersinia pestis during systemic plague

Affiliations

Gr1+ cells control growth of YopM-negative yersinia pestis during systemic plague

Zhan Ye et al. Infect Immun. 2009 Sep.

Abstract

YopM, a protein toxin of Yersinia pestis, is necessary for virulence in a mouse model of systemic plague. We previously reported YopM-dependent natural killer (NK) cell depletion from blood and spleen samples of infected mice. However, in this study we found that infection with Y. pestis KIM5 (YopM(+)) caused depletion of NK cells in the spleen, but not in the liver, and antibody-mediated ablation of NK cells had no effect on bacterial growth. There was no YopM-associated effect on the percentage of dendritic cells (DCs) or polymorphonuclear leukocytes (PMNs) in the early stage of infection; however, there was a YopM-associated effect on PMN integrity and on the influx of monocytes into the spleen. Ablation of Gr1(+) cells caused loss of the growth defect of YopM(-) Y. pestis in both the liver and spleen. In contrast, ablation of macrophages/DCs inhibited growth of both parent and mutant bacteria, accompanied by significantly fewer lesion sites in the liver. These results point toward PMNs and inflammatory monocytes as major cell types that control growth of YopM(-) Y. pestis. Infection with fully virulent Y. pestis CO92 and a YopM(-) derivative by intradermal and intranasal routes showed that the absence of YopM significantly increased the 50% lethal dose only in the intradermal model, suggesting a role for YopM in bubonic plague, in which acute inflammation occurs soon after infection.


Figures
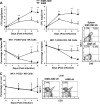
FIG. 1.
FIG. 1.
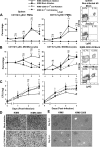
Comparisons of bacterial CFU numbers and NK cell percentages in spleens and livers after infection of C57BL/6 mice with Y. pestis KIM5-3002 (ΔyopM1 mutant) or the parent Y. pestis KIM5. Mice were infected i.v. with 400 CFU of Y. pestis KIM5-3002 or KIM5 strain. (A to C) At the indicated times p.i., the numbers of CFU in the spleen and liver (A) and the percentages of CD3 NK cells in leukocytes from the spleen (B) or liver (C) were determined. Representative flow cytometric scatter plots illustrating the discrimination among cell populations on day 5 p.i. (d5) in the spleen and liver, respectively, are shown to the right of panels B and C. The upper plot in panel B and the left plot in panel C are from individual mice infected with Y. pestis ΔyopM1 mutant strain, and the lower plot in panel B and the right plot in panel C are from individual mice infected with the parent strain. The data in the graphs represent the averages plus SDs (error bars) for 14 mice per datum point for the spleen and 11 mice per datum point for the liver, pooled from replicate experiments. In panel A and panels in all other figures showing CFU, the day 0 points give the total bacterial doses as determined by plating the inocula. Values that are significantly different (P < 0.01) in the KIM5-3002- and KIM5-infected groups are indicated (**).
FIG. 2.
FIG. 2.
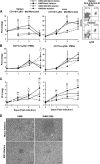
Anti-NK1.1 MAb-mediated NK cell ablation failed to relieve the growth defect due to the ΔyopM1 mutation. Mice were given anti-NK1.1 MAb (NK ablation groups) or rat IgG (mock ablation groups) i.p. 1 day before i.v. infection with 400 CFU of Y. pestis KIM5-3002 (ΔyopM1 mutant) or the parent strain KIM5. The same doses of antibodies were also given to the mice on day 1 and day 3 p.i. (A and B) On days 2, 4, and 5 p.i., the percentages of CD3 NK cells (A) and numbers of CFU (B) in spleens and livers were determined. Representative scatter plots showing the discrimination among cell populations in spleens on day 4 p.i. (d4) of mice infected with Y. pestis ΔyopM1 mutant are shown to the right in panel A. The scatter plots show the results for a mock-treated mouse and a mouse ablated of NK cells. The data in the graphs represent the averages plus SDs (error bars) for six mice per datum point, pooled from replicate experiments. Values that are significantly different in the NK cell-ablated and mock ablation groups of mice infected with KIM5-3002 are indicated as follows: †, P < 0.05; ††, P < 0.01. Values that are significantly different in the NK cell-ablated and mock ablation groups of mice infected with KIM5 are indicated as follows: #, P < 0.05; # #, P < 0.01. (C) Histopathology on day 4 p.i. in liver of NK cell-ablated and mock-treated mice infected with KIM5-3002. The top panels and the bottom panels show typical lesions caused by KIM5-3002. Bars, 20 μm (top panels) and 100 μm (bottom panels).
FIG. 3.
FIG. 3.
Comparison of three DC subgroups in the livers and spleens of mice infected with Y. pestis KIM5-3002 (ΔyopM1 mutant) or the parent Y. pestis KIM5 with or without NK cell ablation. DCs were analyzed from the leukocyte populations obtained in the experiments shown in Fig. 2; the symbols and lines are the same as in Fig. 2. Panels A, B, and C show CD11b+ DCs (10 and 14 mice per datum point for spleen and liver, respectively), CD8+ DCs (10 mice per datum point), and B220+ DCs (11 mice per datum point), respectively, in the spleen and liver. A representative flow cytometric scatter plot illustrating the discrimination among cell populations in the spleen on day 4 p.i. (d4) of a mouse infected with the Y. pestis ΔyopM1 mutant is shown to the right of each panel. The notations for statistically significant values are as in the legend to Fig. 2, with the addition of comparisons between groups of mice infected with KIM5 and KIM5-3002 (**, P < 0.01).
FIG. 4.
FIG. 4.
Ablation of Gr1+ cells relieved the growth defect of the Y. pestis KIM5-3002 (ΔyopM1 mutant). Mice were given anti-Gr1 (Ly6G/Ly6C) MAb (Gr1+ cell ablation groups) or rat IgG (mock ablation groups) i.p. 1 day before and 1 day after i.v. infection with 400 CFU of KIM5-3002 or the parent strain KIM5. (A to C) On days 1, 2, and 3 p.i., the percentage of PMNs (A) and Mφs/monocytes (B) in leukocytes from spleens and livers and numbers of CFU (C) in spleens and livers were determined. Representative scatter plots showing the discrimination among cell populations in the spleens of noninfected and infected mice are shown to the right of panels A and B, respectively. In panel A, the top and bottom plots show the respective cellular distributions on day 0 (d0) of the experiment for a mock-treated mouse and a mouse ablated of Gr1+ cells. In panel B, the top and bottom plots show the respective distributions on day 3 p.i. (d3) for mock-treated mice infected with the ΔyopM1 mutant and the parent strain. The data in the graphs represent the averages plus SDs (error bars) for six mice per datum point for panels A and B and nine mice per point for panel C, pooled from replicate experiments. Values that are significantly different for the Gr1+ cell-ablated and mock ablation groups of mice infected with KIM5-3002 are indicated as follows: †, P < 0.05; ††, P < 0.01. Values that are significantly different for the Gr1+ cell-ablated and mock ablation groups of mice infected with KIM5 are indicated as follows: #, P < 0.05; # #, P < 0.01. Values that are significantly different for mock-treated groups of mice infected with KIM5 and KIM5-3002 are indicated as follows: *, P < 0.05; **, P < 0.01.Values that are significantly different for Gr1+ cell-ablated groups of mice infected with KIM5 and KIM5-3002 are indicated as follows: δ, P < 0.05; δδ, P < 0.01. (D and E) Histopathology in livers from mice that were ablated for Gr1+ cells or mock treated and infected with KIM5 or KIM5-3002. Panel D shows lesions from day 3 p.i. In panel E, differences in numbers and sizes of lesions caused by the two Y. pestis strains are illustrated for both day 2 and day 3 p.i. Bars, 20 μm (D) and 100 μm (E).
FIG. 5.
FIG. 5.
Ablation of Mφs/monocytes with clodronate-liposomes restricted growth of both Y. pestis strains. Mice were given clodronate-liposomes (Mφ/monocyte ablation groups) or PBS-liposomes (mock ablation groups) by the i.v. route 18 h before i.v. infection with 400 CFU of Y. pestis KIM5-3002 (ΔyopM1 mutant) or the parent strain KIM5. The same doses of liposomes were also given to the mice on day 1 p.i. (A to C) On days 1, 2, and 3 p.i., the percentages of Mφs/monocytes (A) and PMNs (B), and numbers of CFU (C) in spleens and livers were determined. Representative flow cytometric scatter plots illustrating the discrimination among cell populations in the spleens from a noninfected mock-treated mouse (top plot) and a noninfected mouse ablated of nongranulocytic myeloid cells (bottom plot) on day 1 (d1) of the experiment are shown to the right of panel A. The data in the graphs represent the averages plus SDs (error bars) for six mice per datum point in panels A and B and from nine and six mice per datum point for the spleen and liver, respectively, in panel C, pooled from replicate experiments. Values that are significantly different (P < 0.01) in the Mφ/monocyte-ablated and mock-treated groups of mice infected with KIM5-3002 are indicated (††). Values that are significantly different in the Mφ/monocyte-ablated and mock-treated groups of mice infected with KIM5 are indicated as follows: #, P < 0.05; # #, P < 0.01. Values that are significantly different (P < 0.01) in the mock-treated mice infected with KIM5 and KIM5-3002 are indicated (**). Values that are significantly different in the Gr1+ cell-ablated mice infected with KIM5 and KIM5-3002 are indicated as follows: δ, P < 0.05; δδ, P < 0.01. (D) Histopathology on day 3 p.i. in the livers of the Mφ/monocyte-ablated and mock-treated mice infected with Y. pestis KIM5 or KIM5-3002. Bars, 50 μm.
FIG. 6.
FIG. 6.
Conditional ablation of Mφs/DCs by Fas-induced apoptosis in transgenic MaFIA mice also restricted growth of Y. pestis KIM5. MaFIA mice were given daily i.v. injections of dimerizer drug AP20187 or mock injection solution for 5 days and then were allowed to rest 2 days before being infected with 200 CFU of Y. pestis KIM5. The numbers of CFU in the liver and spleen on day 4 p.i. were measured. Data (averages plus SDs [error bars]) are from six mice per treatment, pooled from replicate experiments. Values that are significantly different (P < 0.01) from the values for the mock-treated groups are indicated (**).
FIG. 7.
FIG. 7.
Histology in skin after i.d. infection and lung after i.n. infection with Y. pestis CO92.S19 (ΔyopM2 mutant) or with the parent strain, CO92.S6. Tissue samples were harvested from uninfected mice and from mice infected by the fully virulent Y. pestis CO92.S6 and ΔyopM2 derivative 8 h after i.d. infection with ca. 200 CFU (actual doses, 216 CFU for CO92.S6 and 163 CFU for CO92.S19) or 8 h after i.n. infection with 5,100 CFU of CO92.S6 and 4,000 CFU of CO92.S19. (Top panels) Skin near the infection site; (bottom panels) lung shown at fourfold-lower magnification than for skin. Bars, 50 μm (top panels) and 100 μm (bottom panels).
FIG. 8.
FIG. 8.
Model for the pathogenic role of YopM in systemic plague. Mφs, DCs, and PMNs are hypothesized to be important targets of infection by Y. pestis. DCs and resident Mφs provide a protected niche within which the bacteria replicate and amplify the infectious dose. Within the intracellular niche, the bacteria express genes, such as those encoding components of the T3SS and Yops. A local proinflammatory environment develops and recruits PMNs and inflammatory monocytes. After release from the resident cells, the bacteria are armed to survive encounters with infiltrated PMNs and inflammatory monocytes. The monocytes may contribute to the proinflammatory environment. If the yersiniae lack YopM, Gr1+ cells (PMNs and inflammatory monocytes) will clear the bacteria. When the yersiniae express YopM, monocytes are not recruited into spleen, some function of PMNs is undermined, and bacterial growth is unchecked. This effect of YopM could be mediated directly through delivery of YopM to PMNs or indirectly through an effect of YopM that is delivered to myeloid cells, such as Mφs and DCs.

References

    1. Achtman, M., G. Morelli, P. Zhu, T. Wirth, I. Diehl, B. Kusecek, A. J. Vogler, D. M. Wagner, C. J. Allender, W. R. Easterday, V. Chenal-Francisque, P. Worsham, N. R. Thomson, J. Parkhill, L. E. Lindler, E. Carniel, and P. Keim. 2004. Microevolution and history of the plague bacillus, Yersinia pestis. Proc. Natl. Acad. Sci. USA 10117837-17842. - PMC - PubMed
    1. Ardavin, C. 2003. Origin, precursors and differentiation of mouse dendritic cells. Nat. Rev. Immunol. 3582-590. - PubMed
    1. Banchereau, J., and R. M. Steinman. 1998. Dendritic cells and the control of immunity. Nature 392245-252. - PubMed
    1. Beck-Schimmer, B., R. Schwendener, T. Pasch, L. Reyes, C. Booy, and R. C. Schimmer. 2005. Alveolar macrophages regulate neutrophil recruitment in endotoxin-induced lung injury. Respir. Res. 661. - PMC - PubMed
    1. Bendelac, A., P. B. Savage, and L. Teyton. 2007. The biology of NKT cells. Annu. Rev. Immunol. 25297-336. - PubMed

Publication types