. 2009 Jul 13;186(1):11-26.
doi: 10.1083/jcb.200904153. Epub 2009 Jul 6.

Synchronizing chromosome segregation by flux-dependent force equalization at kinetochores

Affiliations

Synchronizing chromosome segregation by flux-dependent force equalization at kinetochores

Irina Matos et al. J Cell Biol. .

Abstract

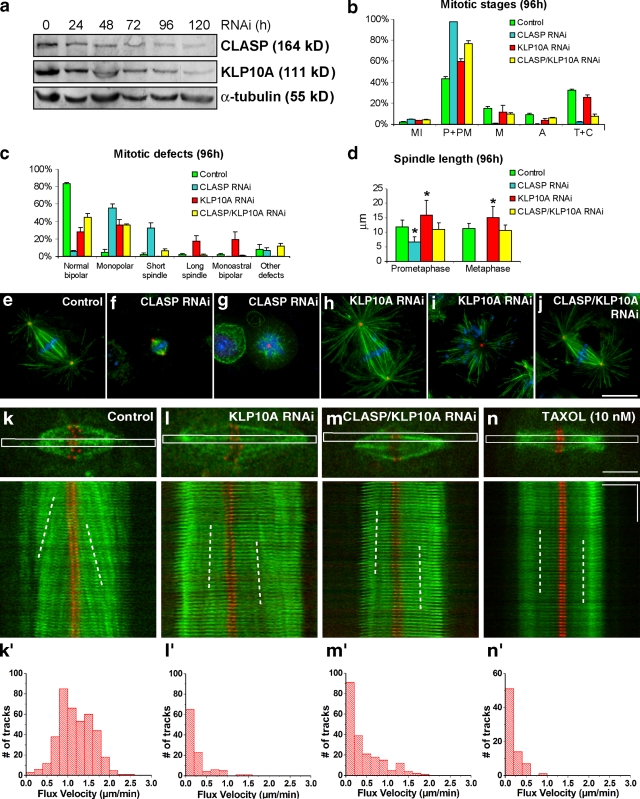
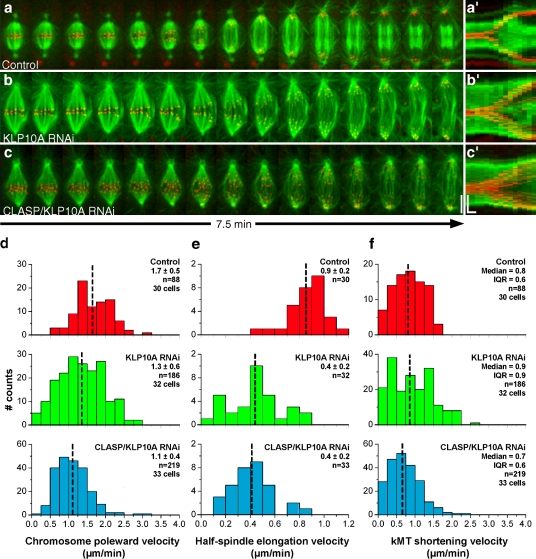
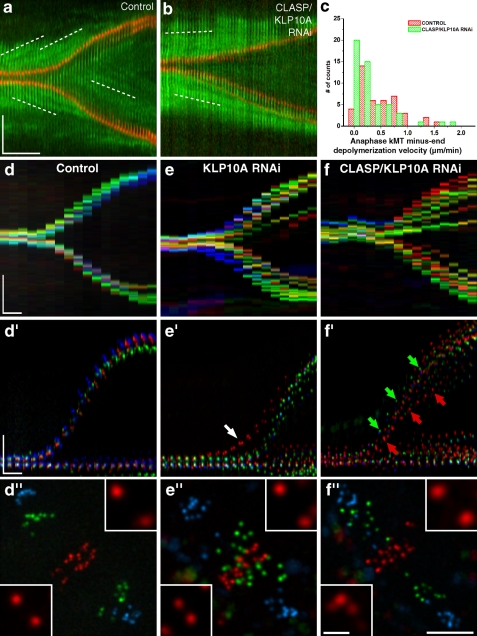
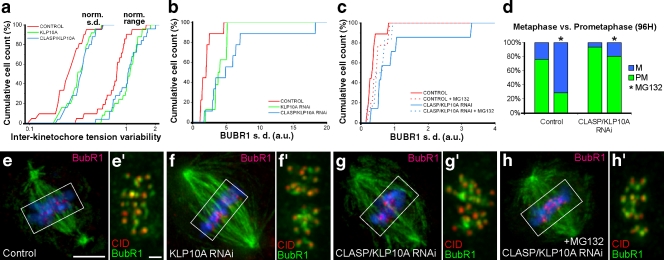
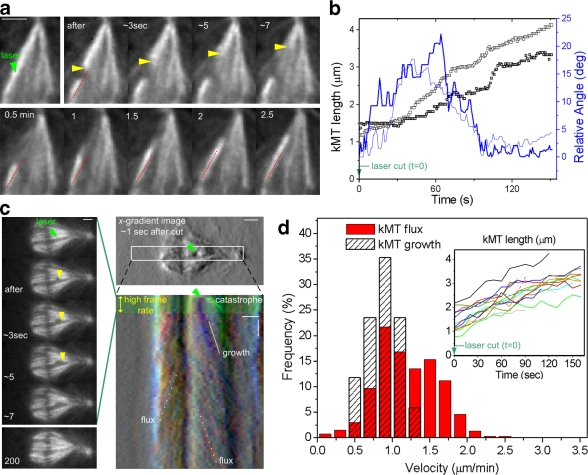
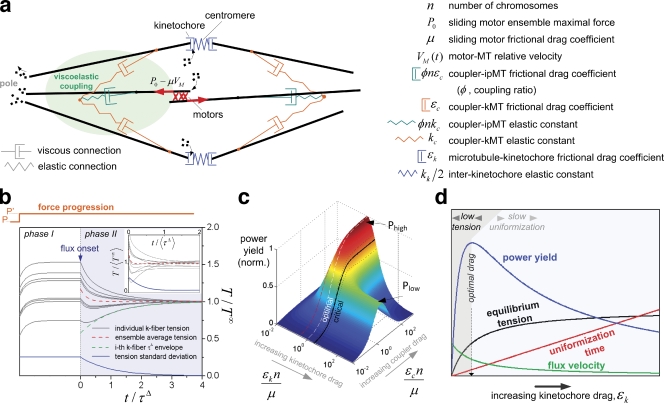
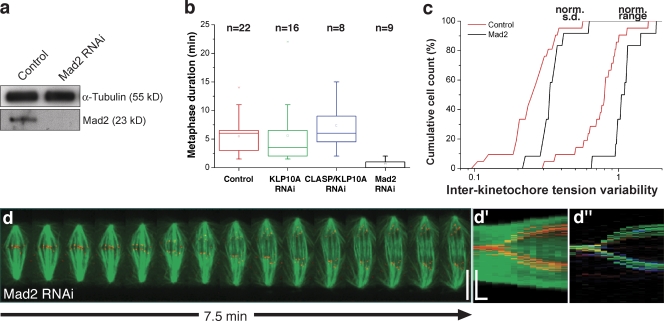
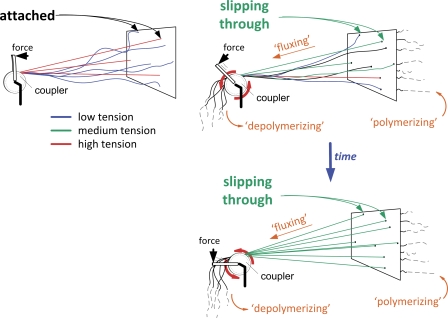
The synchronous movement of chromosomes during anaphase ensures their correct inheritance in every cell division. This reflects the uniformity of spindle forces acting on chromosomes and their simultaneous entry into anaphase. Although anaphase onset is controlled by the spindle assembly checkpoint, it remains unknown how spindle forces are uniformly distributed among different chromosomes. In this paper, we show that tension uniformity at metaphase kinetochores and subsequent anaphase synchrony in Drosophila S2 cells are promoted by spindle microtubule flux. These results can be explained by a mechanical model of the spindle where microtubule poleward translocation events associated with flux reflect relaxation of the kinetochore-microtubule interface, which accounts for the redistribution and convergence of kinetochore tensions in a timescale comparable to typical metaphase duration. As predicted by the model, experimental acceleration of mitosis precludes tension equalization and anaphase synchrony. We propose that flux-dependent equalization of kinetochore tensions ensures a timely and uniform maturation of kinetochore-microtubule interfaces necessary for error-free and coordinated segregation of chromosomes in anaphase.


Figures

Figure 1.
Figure 1.
Phenotypic analyses of CLASP, KLP10A, and CLASP/KLP10A RNAi in Drosophila S2 cells. (a) Western blot analysis after CLASP and KLP10A RNAi at different time points revealed a 70–90% reduction in protein levels after 96 h of RNAi treatment. α-tubulin was used as loading control. (b) Quantification of mitotic parameters reveals a significant rescue of the CLASP phenotype by simultaneous depletion of KLP10A. Note that metaphases and anaphases were restored in the double RNAi experiments. (c and d) Quantification of mitotic defects in controls and after CLASP, KLP10A, and CLASP/KLP10A RNAi show that simultaneous depletion of CLASP and KLP10A significantly restored spindle bipolarity and length. Plotted values in panels b–d represent the mean from three experiments, and error bars represent the respective standard deviations. Asterisks in panel d indicate statistically significant differences when compared with controls (P < 0.001; Mann-Whitney test). (e–j) Immunofluorescence analysis of mitotic spindles from control, CLASP, KLP10A, and CLASP/KLP10A RNAi. MTs (green) and centrosomes (red) were, respectively, revealed with anti–α- and γ-tubulin antibodies, whereas DNA (blue) was counterstained with DAPI. S2 cells stably expressing low levels of GFP-α-tubulin (green) and CID-mCherry (red) were used to analyze kMT poleward flux by FSM. Bar, 10 µm. (k–n) Control (k), KLP10A RNAi (l), CLASP/KLP10A RNAi (m), and Taxol-treated cells (n). Speckle poleward velocity was determined by measuring the slopes obtained from the kymographs (white broken lines). (k′–n′) Distribution of flux velocity in control, KLP10A RNAi, CLASP/KLP10A RNAi, and Taxol-treated cells, respectively. Horizontal bar, 5 µm; vertical bar, 1 min. All treatments were statistically different from controls (P < 0.05; Dunn's test).
Figure 2.
Figure 2.
Analysis of chromosome and spindle dynamics during anaphase. (a–c) S2 cells stably expressing GFP–α-tubulin (green) and CID-mCherry (red) were used to track kinetochore movement and spindle elongation during anaphase. Control (a), KLP10A RNAi (b), and CLASP/KLP10A RNAi cells (c). Bar, 5 µm. (a′–c′) Corresponding collapsed kymograph analysis. Horizontal bar, 60 s; vertical bar, 5 µm. (d) Distribution of chromosome poleward velocity in control, KLP10A, and CLASP/KLP10A RNAi. All RNAi treatments are statistically different from control (P < 0.05; Dunn's test). (e) Distribution of spindle elongation velocity. All RNAi treatments were statistically different from controls (P < 0.001; Student-Newman-Keuls test). (f) Distribution of kMT shortening velocity in control, KLP10A, and CLASP/KLP10A RNAi. The differences were not statistically significant. The mean ± SD or median and interquartile range are indicated for each distribution. The mean or median values are marked with a broken vertical line.
Figure 3.
Figure 3.
Analysis of chromosome segregation during anaphase. (a and b) S2 cells stably expressing low levels of GFP–α-tubulin (green) and CID-mCherry (red) were used to track tubulin speckle movement (white broken lines) relative to spindle MT minus ends by FSM. (a) Control cell. (b) CLASP/KLP10A RNAi cell. Note that in both cases, kinetochores approach the speckles. (c) Distribution of kMT minus end depolymerization velocity in control and CLASP/KLP10A RNAi cells. The differences are statistically significant (P < 0.05; Mann-Whitney test). (d–f) Chromo-kymograph analysis of kinetochores in control, KLP10A RNAi, and CLASP/KLP10A RNAi cells at the metaphase–anaphase transition. (d′–f′) Overlay of guided kymographs showing three kinetochore pairs color coded red/green/blue. Arrows indicate precocious entry of anaphase (white) or differential poleward migration (green/red). (d′′–f′′) Respective projections of three different time frames. Red/green/blue frames correspond to 1, 3.5, and 7 min after anaphase onset. Insets highlight the kinetochore pairs where interkinetochore distances were maximum and minimum. Bars: (space) 5 µm; (time) 1 min; (inset) 1 µm.
Figure 4.
Figure 4.
Experimental analysis of tension uniformity during metaphase. (a) Cumulative histogram for the normalized standard deviation (left) and range (right) of intracellular interkinetochore distances along a metaphase plate for control (n = 21), KLP10A RNAi (n = 25), and CLASP/KLP10A RNAi (n = 25), where n is the number of cells. CLASP/KLP10A RNAi is statistically different from control but not KLP10A RNAi (P < 0.05; Dunn's test). (b) Cumulative histograms for the standard deviation of BubR1 fluorescence intensity for control (n = 10), KLP10A RNAi (n = 7), and CLASP/KLP10A RNAi (n = 7) cells. Both treatments cause a statistically significant variability relative to controls (P < 0.05; Dunn's test). (c) Cumulative histograms for the standard deviation of BubR1 fluorescence intensity on metaphase kinetochores in control and CLASP/KLP10A RNAi before and after incubation with MG132 for 2 h. Note the approximation of the control and CLASP/KLP10A RNAi distributions after MG132 treatment. Only CLASP/KLP10A RNAi is statistically different from controls (P < 0.05; Dunn's test). (d) Quantification of prometaphase and metaphase figures in fixed cells before and after MG132 treatment. Note that CLASP/KLP10A RNAi-treated cells have problems aligning chromosomes at the metaphase plate, which is slightly attenuated if additional time is provided by incubation with MG132. The asterisks indicate the presence of MG132. (e–h) Mitotic spindles from control, KLP10A RNAi, CLASP/KLP10A RNAi, and CLASP/KLP10A RNAi after MG132 treatment, respectively. α-tubulin is shown in green, BubR1 in red, and DNA in blue. Bar, 5 µm. (e′–h′) Insets of the respective metaphase plates indicated in e–h, where CID is shown in red and BubR1 in green. Only cells with aligned chromosomes after CLASP/KLP10A RNAi were used for all quantitative analyses of metaphase. Bar, 1 µm.
Figure 5.
Figure 5.
KMT fiber regrowth after laser microsurgery at near-flux velocity. (a) Selected frames of a laser microsurgery experiment on a kMT fiber during metaphase. The readouts for a successful laser cut are (1) a catastrophe of newly created kMT plus ends (∼20 µm/min) and (2) reorientation of the kinetochore-associated MT fiber after a laser cut (red lines have equal length and slope). (b) kMT fiber length and orientation over time after microsurgery. Data points correspond to two high-speed acquisitions (light and dark lines) in kMT fibers associated with chromosomes positioned at the periphery of the metaphase plate. The relative angle corresponds to the fiber deviation from the initial (presurgery) orientation. (c) FSM during metaphase after laser microsurgery on a kMT fiber. A first high-speed acquisition phase (∼1 s interval) is used to confirm the catastrophe of newly created kMT plus ends (left). After the catastrophe, images are acquired at a 10-s interval to observe kinetochore-associated MT fiber growth and intact kMT fiber flux, as revealed by the chromo-kymograph. The kymograph is based on intensity-gradient images along the horizontal direction, which helped observation of the minus ends of a growing kMT fiber. Green arrowheads in a and c indicate the location of the laser cut. Yellow arrowheads indicate the catastrophe of newly created kMT plus ends after surgery. (d) Velocity distributions of growing kMT fibers after laser microsurgery and of poleward flux, i.e., translocating intact kMT fibers. The elongation of kMT fibers was tracked and is shown in the inset. Bars: (space) 2 µm; (time) 1 min.
Figure 6.
Figure 6.
MT coupling leads to tension uniformity in the presence of flux. (a) Spring-dashpot (elastic-viscous) functional representation of the coupled spindle. Viscous and elastic elements describe both coupler–MT and MT–chromosome interactions. (b) Normalized centromeric tensions as a function of normalized time without flux (phase I) and with flux (phase II). A force P generates initial (random) tension values. A step-increased force (P′) is applied to the system (see “force progression” above the graph). First, to simulate a nonfluxing spindle, phase I shows the system dynamics when no slippage is allowed at the viscous connections, i.e., totally rigid kinetochore–MT and coupler–MT attachments. The system reaches a static (stretched) state when elastic force balances the applied force. Tension heterogeneity (as measured by the standard deviation, blue line) does not decrease because slippage-mediated tension redistribution does not occur. At t = 0, viscous drag coefficients drop to a finite value, allowing slippage to begin (phase II). Throughout phase II, tensions converge with timescale τΔ to the mean tension, which itself decreases (red broken line) to a new asymptotic level T. The inset shows the system behavior when kinetochore–MT attachment drags are variable among chromosomes on the same metaphase plate, following a normal distribution with full width equal to 10% of the mean. (c) Power yield of the mechanical system as a function of normalized MT–coupler drag and normalized kinetochore–MT drag. The system reaches a plateau of highest efficiency (Phigh) when kMTs are tightly coupled to ipMTs (high coupler drag) but only partially coupled to kinetochores (intermediate kinetochore drag). A secondary plateau (Plow) is found if kinetochore drag is higher than a critical value (black line; sub- and supracritical black broken lines are also shown), a condition in which it is beneficial to have a finite coupler drag and infinite kinetochore drag (no kMT flux). Critical kinetochore drag represents an unbiased estimate of the maximal drag expectable for fluxing spindles; i.e., the minimum flux. The critical point-associated power may be used to define the low end of expected drag (red broken line). (d) Summary of the system behavior as a function of kinetochore–MT drag in the high-coupling regime. High kinetochore drag maximizes tension at equilibrium, but it comes at the expense of a long equalization time. The reverse happens for low kinetochore drag, suggesting optimal behavior in an intermediate situation (maximal power yield), where flux velocity is not zero and not as high as it could be if generated by free ipMT motors.
Figure 7.
Figure 7.
Tension uniformity and synchrony analysis after acceleration of mitosis. (a) Western blot showing Mad2 depletion 96 h after RNAi. α-tubulin was used as loading control. (b) Cumulative histogram for the normalized standard deviation (left) and range (right) of intracellular interkinetochore distances along a metaphase plate for control (n = 21) and Mad2 RNAi (n = 12), where n is the number of cells. Mad2 RNAi is statistically different from controls (P < 0.05, Student t test). (c) Metaphase duration in control, KLP10A RNAi, CLASP/KLP10A RNAi, and Mad2 RNAi cells, where n represents the number of cells capable of forming a metaphase plate. The box plot determines the interquartile range, the line inside the box represents the median, the point inside the box represents the mean, and the whiskers determine the limits of the distribution disregarding outliers. Mad2 RNAi is the only treatment that is statistically different from controls (P < 0.001, Mann-Whitney test). (d–d′′) Kymograph (d), collapsed kymograph (d′), and cromo-kymograph (d′′) analysis of a representative Mad2-depleted cell. Vertical scale bar, 10 µm; horizontal time bar, 1 min.
Figure 8.
Figure 8.
Schematic representation of the flux-dependent tension redistribution principle. Several cables (representing kMTs) with random lengths are firmly attached to the wall (representing chromosomes at the metaphase plate). Cables are connected to a coupler, which is subjected to a “rotating force” (torque). In the “no flux” condition (left), the coupler will only rotate up to the point where the first cables become under tension, a point in which they resist further rotation: the system reaches a static equilibrium characterized by large tension heterogeneity. In the strict analogy of inextensible cables, a maximum of three cables experience tension. The “flux” condition (right) is characterized by a single modification: instead of being firmly attached, cables are now passing through tight holes in the wall and thereby slip, although not freely, in response to the applied force. Cable “growth” by slippage allows the coupler to keep rotating, eventually leading to stretching (i.e., development of tension) in previously relaxed cables. The system eventually reaches a dynamic equilibrium, characterized by tension homogeneity, although at the expense of diminished mean tension. For clarity, we represent a point-coupler instead of an extended structure. Rotation of the motorized coupler emulates the linear “hand-over-hand” dynamics that characterize permanent attachment/detachment dynamics of system motors/cross-linkers, which allows maintenance of the coupler “position.”

References

    1. Bakhoum S.F., Thompson S.L., Manning A.L., Compton D.A. 2009. Genome stability is ensured by temporal control of kinetochore-microtubule dynamics.Nat. Cell Biol. 11:27–35 - PMC - PubMed
    1. Basto R., Lau J., Vinogradova T., Gardiol A., Woods C.G., Khodjakov A., Raff J.W. 2006. Flies without centrioles.Cell. 125:1375–1386 - PubMed
    1. Bird A.W., Hyman A.A. 2008. Building a spindle of the correct length in human cells requires the interaction between TPX2 and Aurora A.J. Cell Biol. 182:289–300 - PMC - PubMed
    1. Brangwynne C.P., MacKintosh F.C., Kumar S., Geisse N.A., Talbot J., Mahadevan L., Parker K.K., Ingber D.E., Weitz D.A. 2006. Microtubules can bear enhanced compressive loads in living cells because of lateral reinforcement.J. Cell Biol. 173:733–741 - PMC - PubMed
    1. Brust-Mascher I., Civelekoglu-Scholey G., Kwon M., Mogilner A., Scholey J.M. 2004. Model for anaphase B: role of three mitotic motors in a switch from poleward flux to spindle elongation.Proc. Natl. Acad. Sci. USA. 101:15938–15943 - PMC - PubMed

Publication types

Substances