. 2009 Oct;58(10):2303-15.
doi: 10.2337/db07-1781. Epub 2009 Jul 6.

Mitochondrial networking protects beta-cells from nutrient-induced apoptosis

Affiliations

Mitochondrial networking protects beta-cells from nutrient-induced apoptosis

Anthony J A Molina et al. Diabetes. 2009 Oct.

Abstract

Objective: Previous studies have reported that beta-cell mitochondria exist as discrete organelles that exhibit heterogeneous bioenergetic capacity. To date, networking activity, and its role in mediating beta-cell mitochondrial morphology and function, remains unclear. In this article, we investigate beta-cell mitochondrial fusion and fission in detail and report alterations in response to various combinations of nutrients.

Research design and methods: Using matrix-targeted photoactivatable green fluorescent protein, mitochondria were tagged and tracked in beta-cells within intact islets, as isolated cells and as cell lines, revealing frequent fusion and fission events. Manipulations of key mitochondrial dynamics proteins OPA1, DRP1, and Fis1 were tested for their role in beta-cell mitochondrial morphology. The combined effects of free fatty acid and glucose on beta-cell survival, function, and mitochondrial morphology were explored with relation to alterations in fusion and fission capacity.

Results: beta-Cell mitochondria are constantly involved in fusion and fission activity that underlies the overall morphology of the organelle. We find that networking activity among mitochondria is capable of distributing a localized green fluorescent protein signal throughout an isolated beta-cell, a beta-cell within an islet, and an INS1 cell. Under noxious conditions, we find that beta-cell mitochondria become fragmented and lose their ability to undergo fusion. Interestingly, manipulations that shift the dynamic balance to favor fusion are able to prevent mitochondrial fragmentation, maintain mitochondrial dynamics, and prevent apoptosis.

Conclusions: These data suggest that alterations in mitochondrial fusion and fission play a critical role in nutrient-induced beta-cell apoptosis and may be involved in the pathophysiology of type 2 diabetes.


Figures

FIG. 1.
FIG. 1.
Dissection of the mitochondrial web in primary β-cells using PAGFPmt. A: Projection of confocal images of a cell stained with TMRE. Note that mitochondria are densely packed in β-cells. B: Sequential 2-photon laser photoactivation of individual mitochondria. C: Summary of mitochondrial size distribution performed by 90 photoactivation steps in 9 cells. D: Tagging and tracking individual mitochondria in primary β-cells reveals fusion events (transfer of activated PAGFPmt to juxtaposed unlabeled mitochondria) that are then followed by fission events (separation of previously connected mitochondria). (A high-quality digital representation of this figure is available in the online issue.)
FIG. 2.
FIG. 2.
Mitochondrial morphology is modulated by mitochondrial fusion and fission proteins in β-cells. A: In primary β-cells, overexpression of the fusion protein OPA1 leads to mitochondrial fragmentation. Overexpression was achieved by adenoviral transduction of GFP or OPA1 at equal concentrations of viral particles. B: Level of OPA1 overexpression in INS1 cells was controlled by the dose of viral particles used. Mild overexpression causes mitochondria to take on a dense and elaborate morphology compared with controls. Further increases in OPA1 overexpression levels resulted in mitochondrial fragmentation. C: In primary β-cells, overexpression of DN DRP1 to reduce mitochondrial fission leads to mitochondrial swelling. D: In INS1 cells, overexpression of DN DRP1 leads to network superfusion and a limited amount of mitochondrial swelling. The number and concentration of viral particles used in A, C, and D was identical. (A high-quality digital representation of this figure is available in the online issue.)
FIG. 3.
FIG. 3.
Mitochondrial fusion and fission in primary β-cells. A: Fusion of the photoactivated fraction (∼10%) with the rest of the mitochondrial web dilutes activated PAGFPmt and leads to a reduction in fluorescence intensity. A plateau is reached within ∼40 min. Images are representative Z-projections. B: Dilution of GFP FI is shown for individual cells (n = 6; gray lines) and their average ± SE (●). The average dilution values were fitted (R = 0.99) to a hyperbolic function yielding T50 of 12.1 min. C and D: β-Cells within an intact islet also exhibit mitochondrial dynamics as revealed by the diffusion of the activated PAGFPmt signal. (See Research Design and Methods and supplemental material for imaging and image analysis methodology). E: Fusion activity in primary β-cells is reduced after 24 h in HFG media. Images taken during the assay show that the number of PAGFPmt-positive mitochondria and the FI of PAGFPmt remained unchanged. F: Quantitative summary of PAGFPmt dilution shown 60 and 120 min after photoactivation. The HFG-treated cells possess significantly brighter GFP intensity (P = 0.04) than controls, indicating reduced mitochondrial fusion activity. (A high-quality digital representation of this figure is available in the online issue.)
FIG. 4.
FIG. 4.
Culturing INS1 cells in media with high levels of fatty acids and glucose impairs mitochondrial morphology and dynamics. A: Confocal images of INS1 cells stained with TMRE after 24 h in control (11 mmol/l glucose), HG (20 mmol/l glucose), HFLG (5 mmol/l glucose and 0.4 mmol/l palmitate), HF (11 mmol/l glucose and 0.4 mmol/l palmitate), and HFG (20 mmol/l glucose and 0.4 mmol/l palmitate) media. HF and HFG induce mitochondrial fragmentation within 4 h as opposed to incubation with control, HFLG, and HG media, which induce little or no effect on morphology. Cells possessing >50% fragmented mitochondria were considered fragmented. B: Assessment of mitochondrial fusion activity using the same approach as in Fig. 3. A group of mitochondria were labeled using a 2-photon laser (□, inset). Through fusion events, photoactivated GFP distributed itself throughout the mitochondrial network within 50 min in cells treated with control media. Redistribution is accompanied by dilution of the photoactivated form of PAGFPmt, revealed by the decreased PAGFPmt FI. In cells pretreated with HFG for 24 h (right panel), the activated PAGFPmt remained segregated in the mitochondria where it was initially photoactivated; dilution does not occur and PAGFP FI remains high. C: Quantitative summary of PAGFPmt dilution within the mitochondrial population after 24 h of HFG. ○, Cells exposed to HFG for 24 h; ●, cells incubated in normal growth media for the same amount of time. Average GFP dilution values were fitted (R = 0.99) to a hyperbolic function yielding T50 of 10.1 min only for the normal media group. D: Mitochondrial fusion activity, measured by the ability to dilute PAGFPmt after 50 min. Histogram shows steady-state values of GFP FI obtained 50 min after photoactivation, when the PAGFPmt dilution reached equilibrium. HFG- and HF-treated cells show reduced fusion activity compared with control and HFLG- and HG-treated cells (P <0.05). E: A 4-h HFG treatment is sufficient to reduce the fusion activity of INS1 cell mitochondria to levels similar to those found with 24-h HFG treatment. Mitochondrial fusion activity is not affected by 30-min challenge with 8 and 15 mmol/l glucose. Glucose media was changed from 2 to 8 or 15 mmol/l 10 min prior to photoactivation. The plateau GFP FI level after 50 min is similar to that of the INS1 cells that remained in 2 mmol/l glucose. (A high-quality digital representation of this figure is available in the online issue.)
FIG. 5.
FIG. 5.
Recruitment of DRP1 to mitochondria under HFG is prevented by Fis1 knockdown. A: Western blot and qPCR analysis of INS1 cells infected with control or Fis1 RNAi lentivirus. Fis1 protein level was reduced by 80–90%, and RNA transcripts were reduced by an average of ∼83% (n = 5). B: INS1 cells expressing mitochondrially targeted DsRed were stained for DRP1 (green). After 3.5 h of HFG incubation, DRP1 puncta are abundant in the control RNAi cells but not in the Fis1 RNAi cells. C: Quantification of DRP1 recruitment to mitochondria after 3.5-h exposure to HFG (n = 7 for each group). D: Western blot analysis indicates that the changes in DRP1 recruitment observed were not due to changes in DRP1 expression levels because these remained the same in all the treatments tested. (A high-quality digital representation of this figure is available in the online issue.)
FIG. 6.
FIG. 6.
Fis1 RNAi restores mitochondrial morphology and dynamics under HFG in INS1 cells. A: Mitochondrial morphometry. Mitochondria were classified according to AR into short (AR <2), intermediate, (2<AR<4), and long (AR >4) length (n = 8 cells per group). B: Whole-cell mitochondrial fusion assays (PAGFPmt dilution) in Fis1 RNAi INS1 cells exposed to HFG for 24 h (▲). A hyperbolic fitting yielded T50 = 7.6 min. Fis1 RNAi cells not exposed to HFG are also plotted (♦). Values of control RNAi cells with and without HFG treatment were imported from Fig. 3C (■ and ○, respectively). C: Mitochondrial movement was calculated by measuring the velocity of single mitochondria over time. Velocities are not significantly different between groups (P >0.05). Control RNAi with and without HFG treatment are represented by ■ and □, respectively. Fis1 RNAi cells with and without HFG treatment are represented by formula image 
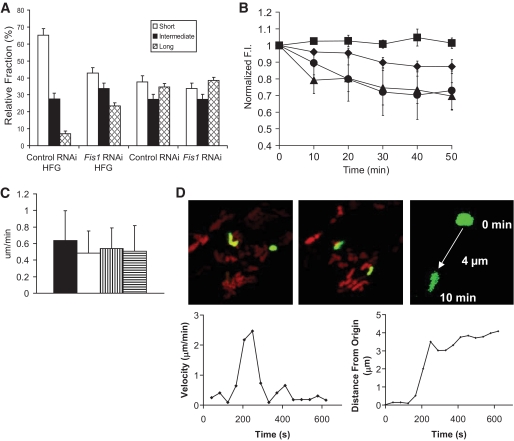
and ▤, respectively. D: Confocal images demonstrating mitochondrial movement analysis. Images at time 0 and 10 min are portrayed. The last image zooms to one mitochondrion and the movement over 10 min is depicted, in this case 4 μm over 10 min. The velocity over time is plotted and indicates a peak around 250 s. When the distance from the origin is plotted over time, it is evident that mitochondria do not move at a constant speed. (A high-quality digital representation of this figure is available in the online issue.)
FIG. 7.
FIG. 7.
Effect of Fis1 RNAi on HFG-induced apoptosis in INS1 cells. A: Immunostaining for cleaved caspase-3 in Fis1 RNAi and control RNAi INS1 cells exposed to HFG for 24 h. Lower panels show the experiment repeated but with cells treated to secondary antibody only. B: Transferase-mediated dUTP nick-end labeling staining of cells treated with the same conditions described in A. C: Fluorescence-activated cell sorter analysis for the apoptotic marker annexin V shows a reduction in cell death in Fis1 RNAi cells compared with control RNAi. Both groups were exposed to HFG for 24 h prior to analysis. D: Western blot analysis of Akt and its downstream target pAkt; β-actin serves as a loading control. E: Insulin secretion measurements were performed on INS1 cells infected with control or Fis1 RNAi lentivirus. Cells were incubated for 4 h in 11 mmol/l glucose or HFG media, sufficient time to achieve mitochondrial fragmentation and impaired fusion capacity. After a 1-h washout period, cells were preincubated with 3 mmol/l glucose for 30 min. Insulin was measured after 30-min exposure to 3 mmol/l glucose (■), 15 mmol/l glucose (□), or 15 mmol/l glucose with 40 mmol/l KCl (▤). Incubation of control cells in HFG media resulted in a decrease in GSIS (P = 0.023), which is not restored by knockdown of Fis1 (P = 0.43). (A high-quality digital representation of this figure is available in the online issue.)

Comment in

  • Diabetes. 58:2185.

References

    1. Skulachev VP: Mitochondrial filaments and clusters as intracellular power-transmitting cables. Trends Biochem Sci 2001; 26: 23– 29 - PubMed
    1. Frank S: Dysregulation of mitochondrial fusion and fission: an emerging concept in neurodegeneration. Acta Neuropathol (Berl) 2006; 111: 93– 100 - PubMed
    1. Nakada K, Inoue K, Ono T, Isobe K, Ogura A, Goto YI, Nonaka I, Hayashi JI: Inter-mitochondrial complementation: mitochondria-specific system preventing mice from expression of disease phenotypes by mutant mtDNA. Nat Med 2001; 7: 934– 940 - PubMed
    1. Arimura S, Yamamoto J, Aida GP, Nakazono M, Tsutsumi N: Frequent fusion and fission of plant mitochondria with unequal nucleoid distribution. Proc Natl Acad Sci U S A 2004; 101: 7805– 7808 - PMC - PubMed
    1. Chen H, Chomyn A, Chan DC: Disruption of fusion results in mitochondrial heterogeneity and dysfunction. J Biol Chem 2005; 280: 26185– 26192 - PubMed

Publication types