

Intramuscular lipid metabolism in the insulin resistance of smoking
- PMID: 19581421
- PMCID: PMC2750212
- DOI: 10.2337/db09-0481
Intramuscular lipid metabolism in the insulin resistance of smoking
Abstract
Objective: Smoking decreases insulin action and increases the risk of type 2 diabetes in humans. Mechanisms responsible for smoking-induced insulin resistance are unclear. We hypothesized smokers would have increased intramuscular triglyceride (IMTG) and diacylglycerol (DAG) concentration and decreased fractional synthesis rate (FSR) compared with nonsmokers.
Research design and methods: Nonsmokers (n = 18, aged 20 +/- 0.5 years, BMI 22 +/- 0.4 kg/m(2), body fat 20 +/- 2%, 0 cigarettes per day) and smokers (n = 14, aged 21 +/- 0.7 years, BMI 23 +/- 0.4 kg/m(2), body fat 20 +/- 3%, 18 +/- 0.7 cigarettes per day) were studied in a fasted condition after a standardized diet. [U-(13)C]palmitate was infused during 4 h of rest followed by a skeletal muscle biopsy and intravenous glucose tolerance test.
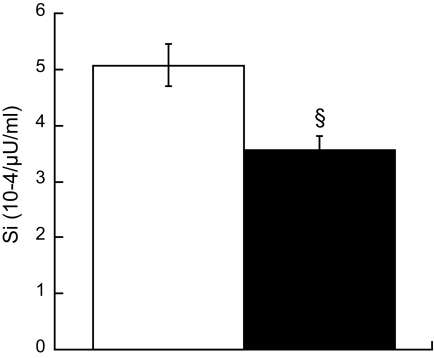
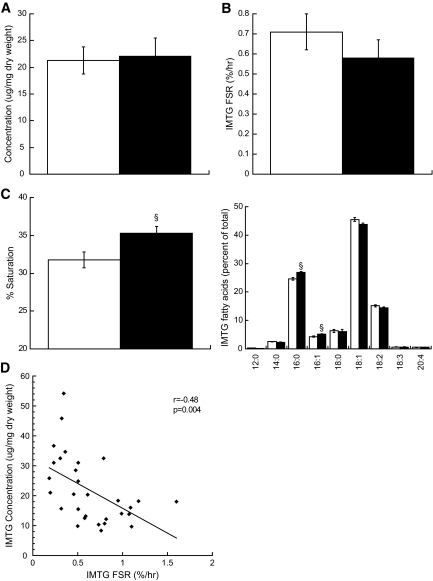
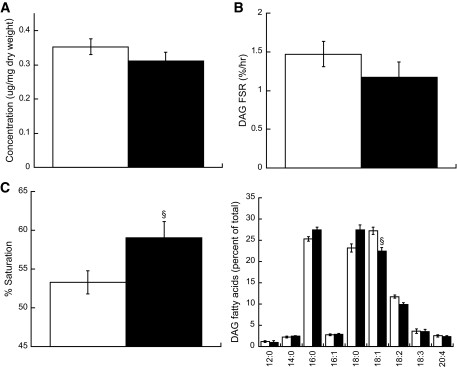
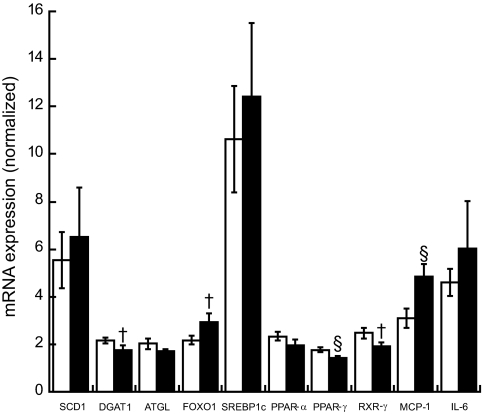
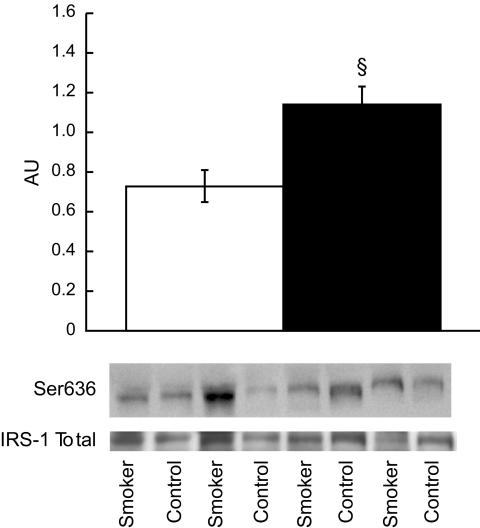
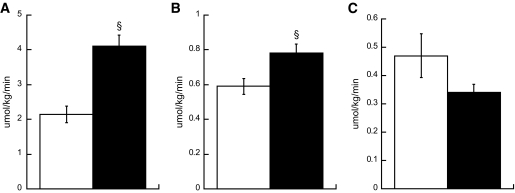
Results: Smokers were less insulin sensitive (S(i)) compared with nonsmokers (S(i) 5.28 +/- 0.5 nonsmokers vs. 3.74 +/- 0.3 smokers 10(-4) x microU(-1) x ml(-1), P = 0.03). There were no differences in IMTG or DAG concentration (IMTG 24.2 +/- 3.4 nonsmokers vs. 27.2 +/- 5.9 smokers microg/mg dry wt, DAG 0.34 +/- 0.02 nonsmokers vs. 0.35 +/- 0.02 smokers microg/mg dry wt) or IMTG FSR between groups (0.66 +/- 0.1 nonsmokers vs. 0.55 +/- 0.09 smokers %/hr). Intramuscular lipid composition was different, with increased percent saturation of IMTG (32.1 +/- 1.2 nonsmokers vs. 35.2 +/- 1.0 smokers %, P = 0.05) and DAG (52.8 +/- 1.7 nonsmokers vs. 58.8 +/- 2.2 smokers %, P = 0.04) in smokers. Smokers had significantly decreased peroxisome proliferator-activated receptor-gamma (1.76 +/- 0.1 nonsmokers vs. 1.42 +/- 0.11 smokers arbitrary units [AU], P = 0.03) and increased monocyte chemotactic protein-1 (3.11 +/- 0.41 nonsmokers vs. 4.83 +/- 0.54 smokers AU, P = 0.02) mRNA expression compared with nonsmokers. We also found increased insulin receptor substrate-1 Ser(636) phosphorylation in smokers compared with nonsmokers (0.73 +/- 0.08 nonsmokers vs. 1.14 +/- 0.09 smokers AU, P = 0.002).
Conclusions: These data suggest: 1) IMTG concentration and turnover are not related to alterations in insulin action in smokers compared to nonsmokers, 2) increased saturation of IMTG and DAG in skeletal muscle may be related to insulin action, and 3) basal inhibition of insulin receptor substrate-1 may decrease insulin action in smokers.
Figures
Similar articles
-
Increased intramuscular lipid synthesis and low saturation relate to insulin sensitivity in endurance-trained athletes.J Appl Physiol (1985). 2010 May;108(5):1134-41. doi: 10.1152/japplphysiol.00684.2009. Epub 2010 Mar 18. J Appl Physiol (1985). 2010. PMID: 20299618 Free PMC article.
-
Fenofibrate administration does not affect muscle triglyceride concentration or insulin sensitivity in humans.Metabolism. 2011 Aug;60(8):1107-14. doi: 10.1016/j.metabol.2010.12.003. Epub 2011 Feb 8. Metabolism. 2011. PMID: 21306746 Free PMC article.
-
Altered intramuscular lipid metabolism relates to diminished insulin action in men, but not women, in progression to diabetes.Obesity (Silver Spring). 2010 Nov;18(11):2093-100. doi: 10.1038/oby.2010.76. Epub 2010 Apr 8. Obesity (Silver Spring). 2010. PMID: 20379150 Free PMC article.
-
The effect of exercise and nutrition on intramuscular fat metabolism and insulin sensitivity.Annu Rev Nutr. 2010 Aug 21;30:13-34. doi: 10.1146/annurev.nutr.012809.104817. Annu Rev Nutr. 2010. PMID: 20373917 Review.
-
High intramuscular triglyceride turnover rates and the link to insulin sensitivity: influence of obesity, type 2 diabetes and physical activity.Appl Physiol Nutr Metab. 2022 Apr;47(4):343-356. doi: 10.1139/apnm-2021-0631. Epub 2022 Jan 21. Appl Physiol Nutr Metab. 2022. PMID: 35061523 Review.
Cited by
-
From Pre-Diabetes to Diabetes: Diagnosis, Treatments and Translational Research.Medicina (Kaunas). 2019 Aug 29;55(9):546. doi: 10.3390/medicina55090546. Medicina (Kaunas). 2019. PMID: 31470636 Free PMC article. Review.
-
IRLnc: a novel functional noncoding RNA contributes to intramuscular fat deposition.BMC Genomics. 2021 Feb 1;22(1):95. doi: 10.1186/s12864-020-07349-5. BMC Genomics. 2021. PMID: 33522899 Free PMC article.
-
Localisation and composition of skeletal muscle diacylglycerol predicts insulin resistance in humans.Diabetologia. 2012 Apr;55(4):1140-50. doi: 10.1007/s00125-011-2419-7. Epub 2012 Jan 15. Diabetologia. 2012. PMID: 22252470 Free PMC article.
-
Nicotine and insulin resistance: when the smoke clears.Diabetes. 2012 Dec;61(12):3078-80. doi: 10.2337/db12-1100. Diabetes. 2012. PMID: 23172960 Free PMC article. No abstract available.
-
Sex difference in the associations among secondhand smoke with metabolic syndrome in non-smokers in a large Taiwanese population follow-up study.Int J Med Sci. 2024 May 28;21(8):1518-1528. doi: 10.7150/ijms.97306. eCollection 2024. Int J Med Sci. 2024. PMID: 38903920 Free PMC article.
References
-
- Centers for Disease Control. Cigarette smoking among Adults—United States, 2007. MMWR 2008;57:1221–1226 - PubMed
-
- Feskens EJ, Kromhout D: Cardiovascular risk factors and the 25-year incidence of diabetes mellitus in middle-aged men. The Zutphen Study. Am J Epidemiol 1989;130:1101–1108 - PubMed
-
- Attvall S, Fowelin J, Lager I, Von Schenck H, Smith U: Smoking induces insulin resistance: a potential link with the insulin resistance syndrome. J Intern Med 1993;233:327–332 - PubMed
-
- Frati AC, Iniestra F, Ariza CR: Acute effect of cigarette smoking on glucose tolerance and other cardiovascular risk factors. Diabetes Care 1996;19:112–118 - PubMed
Publication types
MeSH terms
Substances
Grants and funding
LinkOut - more resources
Full Text Sources
Medical
Molecular Biology Databases
Research Materials
