. 2009 Oct;57(10):973-89.
doi: 10.1369/jhc.2009.954180. Epub 2009 Jul 6.

Cellular inflammatory response to flaviviruses in the central nervous system of a primate host

Affiliations

Cellular inflammatory response to flaviviruses in the central nervous system of a primate host

Olga A Maximova et al. J Histochem Cytochem. 2009 Oct.

Abstract

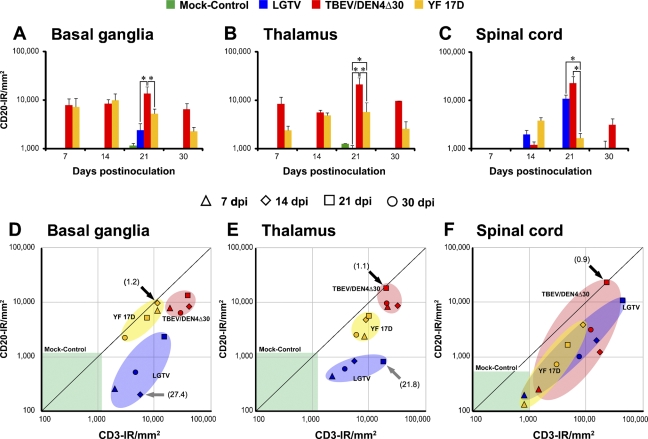
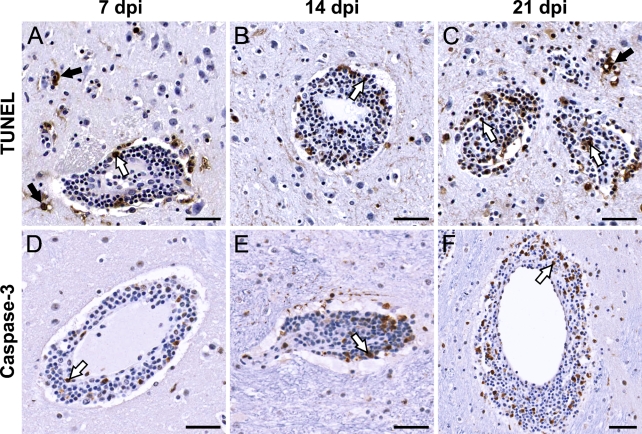
Flaviviruses such as tick-borne encephalitis virus, Japanese encephalitis virus, West Nile virus, and St. Louis encephalitis virus are important neurotropic human pathogens, typically causing a devastating and often fatal neuroinfection. Flaviviruses induce neuroinflammation with typical features of viral encephalitides, including inflammatory cell infiltration, activation of microglia, and neuronal degeneration. Development of safe and effective live-virus vaccines against neurotropic flavivirus infections demands a detailed knowledge of their neuropathogenesis in a primate host that is evolutionarily close to humans. Here, we used computerized morphometric analysis to quantitatively assess the cellular inflammatory responses in the central nervous system (CNS) of rhesus monkeys infected with three antigenically divergent attenuated flaviviruses. The kinetics, spatial pattern, and magnitude of microglial activation, trafficking of T and B cells, and changes in T cell subsets within the CNS define unique phenotypic signatures for each of the three viruses. Our results provide a benchmark for investigation of cellular inflammatory responses induced by attenuated flaviviruses in the CNS of primate hosts and provide insight into the neuropathogenesis of flavivirus encephalitis that might guide the development of safe and effective live-virus vaccines.


Figures

Figure 1
Figure 1
Computerized morphometric analysis (CMA) of immunostained cellular markers. (A,B) CMA of the activated microglia/macrophages [CD68-immunoreactivity (CD68-IR)] in the basal ganglia and thalamus of monkeys inoculated with yellow fever 17D (YF 17D) vaccine virus. (A) Neuroanatomical orientation and mapping of the central nervous system (CNS) regions of interest (ROIs) in the original scanned image using the “Primate Brain Maps: Structure of the Macaque Brain” CD (Martin and Bowden, 2000). (B) Outlining the ROI and applying the CD68-IR–customized positive pixel count algorithm. Results of ROI analysis are shown in the markup image by pseudo-color overlay (orange, moderately positive pixels; red, strong positive pixels; blue, negative pixels; white, neutral pixels that are neither positive nor negative). Inset in B shows the boxed area of thalamus (1 mm2) at higher magnification. Arrows (black in A, and yellow in B and inset) show intensive CD68-IR within and adjacent to the needle track resulting from intrathalamic inoculation of the virus. Yellow arrowheads in inset show CD68-IR on the periphery of perivascular inflammatory infiltrates within the zone of inoculation. AM, anteromedial nucleus of thalamus; AV, anteroventral nucleus of thalamus; bcc, body of corpus callosum; BCd, body of caudate nucleus; bfx, body of fornix; BLV, body of lateral ventricle; CM, central medial nucleus of thalamus; GP, globus pallidus; ic, internal capsule; opt, optic tract; Rt, reticular nucleus of thalamus; Pu, putamen; Re, reuniens nucleus of thalamus; VA, ventral anterior nucleus of thalamus; VLM, medial part of ventral lateral nucleus of thalamus; 3V, third ventricle. (C,D) CMA of the T cell infiltration (CD3-IR) in the spinal cord of monkeys inoculated with YF 17D vaccine virus. (C) Original scanned image of entire cross-section of the cervical region of the spinal cord. (D) Markup image showing the outlined ROI with applied CD3-IR–customized positive pixel count algorithm (red, strong positive pixels; blue, negative pixels; white, neutral pixels). Inset in D shows the circled area (1 mm diameter) of the ventral horn at higher magnification. Yellow arrows, perivascular CD3-IR; yellow arrowheads, parenchymal CD3-IR.
Figure 2
Figure 2
Monocyte/macrophage infiltration and microglial activation in the zone of inoculation. Representative images of CD68-IR (brown) are shown on indicated days postinoculation (dpi) in the thalamus of mock-control monkeys (A–C) or monkeys infected with Langat virus (LGTV) (D–F), chimeric tick-borne encephalitis/dengue type 4 virus (TBEV/DEN4Δ30) (G–I), or YF 17D (J–L). Black arrows, CD68+ cells with non-uniform cytoplasmic immunolabeling and morphology of phagocytic “foamy” macrophages; arrowheads, CD68+-activated microglia; red circles, activated microglial cells engulfing or immediately adjacent to the degenerating/dying neurons and/or neuronal debris; white arrows, CD68+ cells forming a linear profile (needle track). Bar = 50 μm (also applies to B–L).
Figure 3
Figure 3
Monocyte/macrophage infiltration and microglial activation in the putamen of monkeys infected with LGTV (A,D,G,J), TBEV/DEN4Δ30 (B,E,H,K), or YF 17D (C,F,I,L). Representative images of CD68-IR (brown) are shown on indicated dpi. PVS, perivascular space; white arrows, perivascular CD68+ macrophages; black arrows, CD68+ macrophages within the perivascular inflammatory infiltrates; arrowheads, CD68+-activated microglia; red circles, activated microglial cells engulfing or immediately adjacent to the degenerating/dying neurons and/or neuronal debris. Bar = 50 μm (also applies to B–L).
Figure 4
Figure 4
Time course of CD68-IR in the CNS of infected monkeys. Mean values of CD68-IR per mm2 of tissue and standard errors (SEs) are shown on indicated dpi for the following CNS regions: (A) basal ganglia (included caudate nucleus, putamen, and globus pallidus); (B) thalamus; and (C) spinal cord (included cervical and lumbar regions). Statistically significant differences in the mean CD68-IR values at 21 dpi (three to four monkeys per virus group) are indicated with asterisks (p<0.05).
Figure 5
Figure 5
T cells infiltrate the brain parenchyma of flavivirus-infected monkeys within 3 days. (A) Schematic illustration of postcapillary venule showing the steps in the process of migration of CD3+ T cells from the blood into the perivascular space and brain parenchyma (the same sequence of events was also observed for CD20+ B cell infiltration, not shown). (B) Representative corresponding image showing CD3+ T cell infiltration in the thalamus of YF 17D–infected monkey at 3 dpi. Blue arrows in both panels show the first step of infiltration, which involved the adhesion of T cells to the endothelium (1, dark blue). Green arrow shows their passage across the endothelium and inner and outer vascular basement membranes (2 and 3, blue) into the perivascular space. Yellow arrow shows the second step, which involved the passage of T cells into the parenchyma across the basement membrane on top of the glia limitans (4, light purple). Red arrows on both panels point to T cells extravasated into the parenchyma. Black arrowhead, T cell within the lumen of the vessel; white arrowhead, T cell in the perivascular space. E, endothelium; M, media; PVS, perivascular space; GL, glia limitans.
Figure 6
Figure 6
Topographical localization of infiltrating T and B cells within the CNS compartments. Representative adjacent sections showing the central gray matter of the spinal cord of a TBEV/DEN4Δ30–infected monkey at 21 dpi. First column, original images of T cells (A,D,G) and B cells (J). Second column (B,E,H,K), corresponding markup images with IR (positive pixels; orange-red) within the perivascular spaces. Third column (C,F,I,L), corresponding markup images with IR within the parenchyma. Asterisks, the central canal; black arrows, T or B cells located inside blood vessels; white arrows, T or B cells located within the perivascular space; arrowheads (black or white), T or B cells located within the parenchyma. Negative pixels are shown in blue. Neutral pixels (neither positive nor negative) are shown in white. Bar = 100 μm (also applies to B–L).
Figure 7
Figure 7
Time course of T cell infiltration in the CNS of infected monkeys (upper panel): Mean values of IR for CD3 (A–C), CD4 (D–F), and CD8 (G–I) and SE are shown on indicated dpi for the basal ganglia, thalamus, and spinal cord. Statistically significant differences in the mean values at 21 dpi (three to four monkeys per virus group) are indicated with asterisks (p<0.05). Lower panel, analysis of the relative proportions of infiltrating CD4+ and CD8+ T cells. (J,L,N) Scatter plots showing the relative proportions of CD4+ and CD8+ T cells in the basal ganglia, thalamus, and spinal cord of monkeys infected with LGTV (blue), TBEV/DEN4Δ30 (red), or YF 17D (yellow) on indicated dpi. The ranges of CD4-IR and CD8-IR values in the CNS regions of mock-control monkeys (one monkey per each time point) are shown by the green boxes. (K,M,O) The ratios of CD4+ to CD8+ cells in the CNS on indicated dpi. Ratios of 1.0 to 1.2 (representing equal or similar CD4-IR and CD8-IR) are shown by gray arrows, whereas CD4:CD8 ratios below 1.0 are shown by black arrows (J–O).
Figure 8
Figure 8
B cell infiltration in the CNS of infected monkeys. Representative images of CD20-IR on indicated dpi are shown in the basal ganglia (A–C,G–L) and in the spinal cord [(D,F), ventral horn; and (E), Clarke's column]. PVS, perivascular space; white arrows, B cells located within the perivascular inflammatory infiltrates; arrowheads, B cells located within the parenchyma. Inset in C shows the boxed area at higher magnification: intravascular B cell (green arrow); B cell extravasating into the perivascular space (yellow arrow); and B cell leaving the perivascular space to invade the parenchyma (red arrow). Note: white arrowheads in D show B cells situated close to the degenerating neuron. Bars: A = 50 μm (also applies to B–L); inset in C = 10 μm.
Figure 9
Figure 9
Time course of B cell infiltration in the CNS of infected monkeys (A–C). Mean values of CD20-IR and SEs are shown on indicated dpi for the basal ganglia (A), thalamus (B), and spinal cord (C). Statistically significant differences in the mean values at 21 dpi (three to four monkeys per virus group) are indicated with asterisks (p<0.05). Analysis of the relative proportions of infiltrating T and B cells (D–F). Scatter plots showing relative proportions of T cells (CD3-IR/mm2) and B cells (CD20-IR/mm2) in the CNS of monkeys inoculated with LGTV (blue), TBEV/DEN4Δ30 (red), or YF 17D (yellow) on indicated dpi. Ratios representing equal or similar proportions of T and B cells are shown by black arrows. Ratios representing greater proportions of T cells compared with B cells are shown by gray arrows. The ranges of CD3-IR and CD20-IR values in the CNS regions of mock-control monkeys (one monkey per each time point) are shown by the green boxes.
Figure 10
Figure 10
Apoptosis within the CNS of infected monkeys. Representative images of terminal deoxynucleotidyl transferase-mediated deoxyuridine triphosphate nick-end labeling (TUNEL) (A–C) and activated caspase-3 (D–F) staining in the basal ganglia (putamen, A–D,F) and thalamus (E) of monkeys inoculated with TBEV/DEN4Δ30 virus are shown on indicated dpi. White arrows, TUNEL+ or activated caspase-3+ cells within the perivascular inflammatory infiltrates. These cells may represent lymphocytes and/or macrophages. Black arrows, TUNEL+ cells within the parenchyma adjacent to the perivascular inflammatory infiltrates. These TUNEL+ cells may represent dying neurons and/or glial cells. Note: activated caspase-3+ cells are predominantly located within the perivascular inflammatory infiltrates. Bar = 50 μm (applies to A–F).

Similar articles

Cited by

References

    1. Barcia C, Gomez A, de Pablos V, Fernández-Villalba E, Liu C, Kroeger KM, Martín J, et al. (2008) CD20, CD3, and CD40 ligand microclusters segregate three-dimensionally in vivo at B-cell-T-cell immunological synapses after viral immunity in primate brain. J Virol 82:9978–9993 - PMC - PubMed
    1. Bergmann CC, Lane TE, Stohlman SA (2006) Coronavirus infection of the central nervous system: host-virus stand-off. Nat Rev Microbiol 4:121–132 - PMC - PubMed
    1. Best SM, Morris KL, Shannon JG, Robertson SJ, Mitzel DN, Park GS, Boer E, et al. (2005) Inhibition of interferon-stimulated JAK-STAT signaling by a tick-borne flavivirus and identification of NS5 as an interferon antagonist. J Virol 79:12828–12839 - PMC - PubMed
    1. Binder GK, Griffin DE (2001) Interferon-gamma-mediated site-specific clearance of alphavirus from CNS neurons. Science 293:303–306 - PubMed
    1. Bréhin AC, Mouries J, Frenkiel MP, Dadaglio G, Despres P, Lafon M, Couderc T (2008) Dynamics of immune cell recruitment during West Nile encephalitis and identification of a new CD19+B220-BST-2+ leukocyte population. J Immunol 180:6760–6767 - PubMed

Publication types

MeSH terms