. 2009 Jul;27(7):659-66.
doi: 10.1038/nbt.1549. Epub 2009 Jul 5.

Synergistic drug combinations tend to improve therapeutically relevant selectivity

Affiliations

Synergistic drug combinations tend to improve therapeutically relevant selectivity

Joseph Lehár et al. Nat Biotechnol. 2009 Jul.

Erratum in

  • Nat Biotechnol. 2009 Sep;27(9):864

Abstract

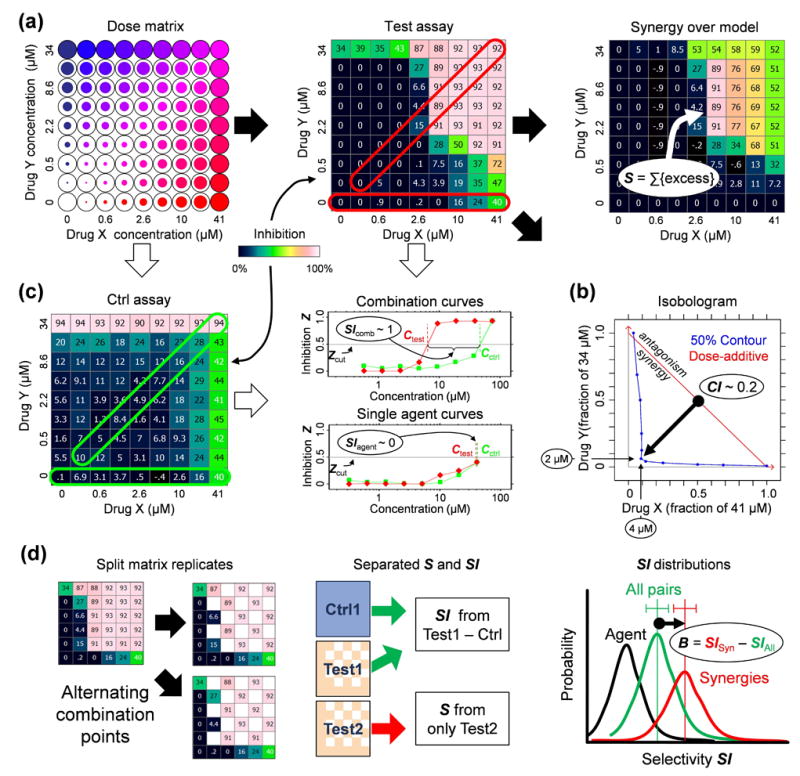
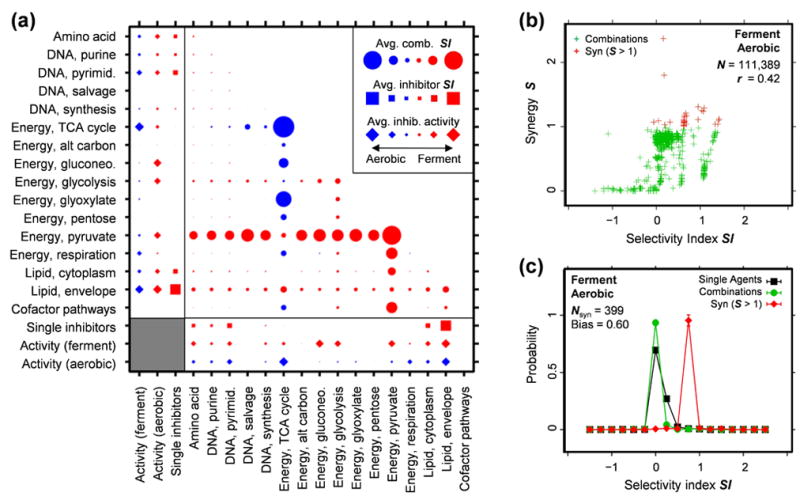
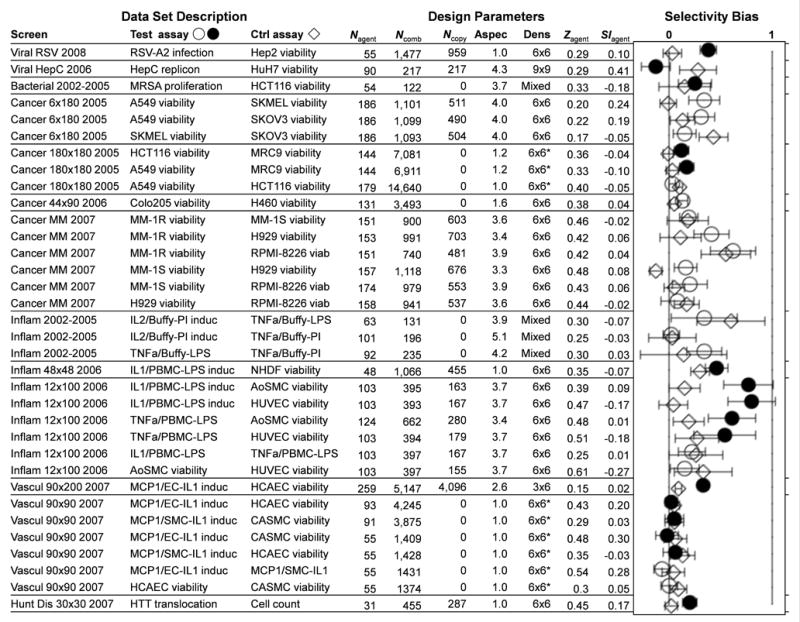
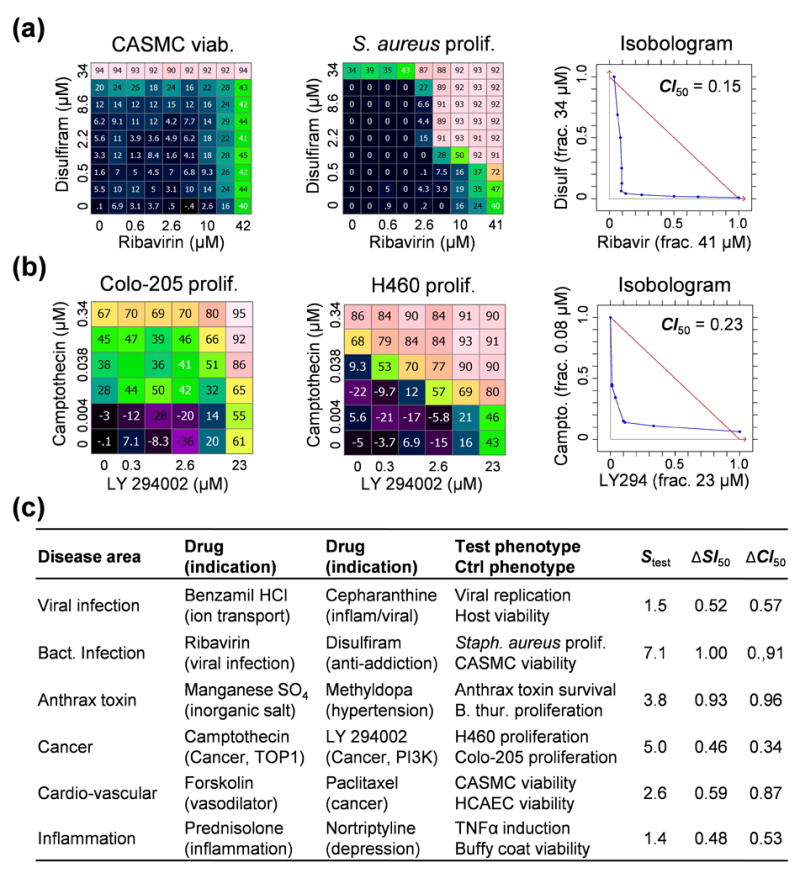
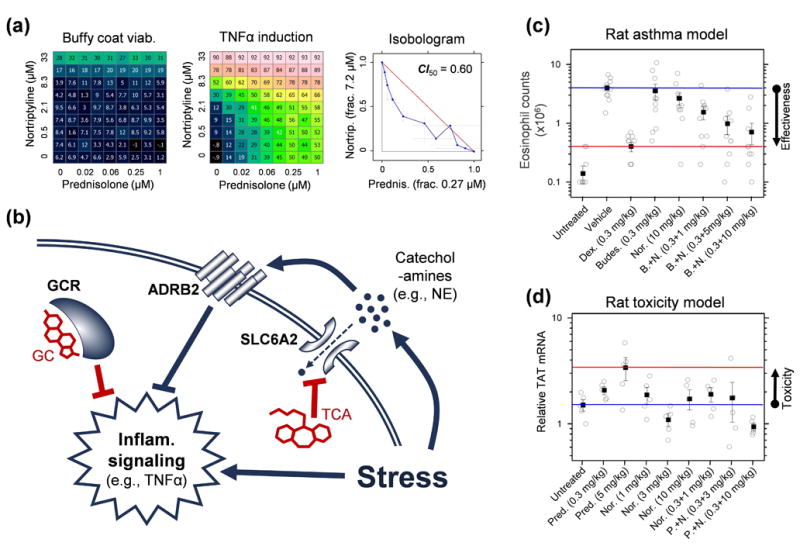
Drug combinations are a promising strategy to overcome the compensatory mechanisms and unwanted off-target effects that limit the utility of many potential drugs. However, enthusiasm for this approach is tempered by concerns that the therapeutic synergy of a combination will be accompanied by synergistic side effects. Using large scale simulations of bacterial metabolism and 94,110 multi-dose experiments relevant to diverse diseases, we provide evidence that synergistic drug combinations are generally more specific to particular cellular contexts than are single agent activities. We highlight six combinations whose selective synergy depends on multitarget drug activity. For one anti-inflammatory example, we show how such selectivity is achieved through differential expression of the drugs' targets in cell types associated with therapeutic, but not toxic, effects and validate its therapeutic relevance in a rat model of asthma. The context specificity of synergistic combinations creates many opportunities for therapeutically relevant selectivity and enables improved control of complex biological systems.


Figures

Figure 1
Figure 1
Measuring the selectivity bias. (a) Determining synergy using dose matrix data. A factorial dose matrix samples all mixtures of two serially-diluted single agents’ concentrations. Phenotypic measurements, like inhibition Z relative to vehicle-treated samples, can be visualized over the matrix using a color scale, and each data point be compared to expected values via a null model (e.g., the highest-single-agent or dose-additive model, see Methods) derived from the single agent data along the left and bottom edges of the matrix. The synergy score S = ln fX ln fY Σdoses max(0,Zdata) (ZdataZmodel) sums up the excess inhibition over the HSA model with weights to account for drug dilution factors fX,fY, and favor synergy at high inhibition levels. (b) Synergy can also be described using an isobologram, which compares the doses along an equal-effect contour (in blue) for a chosen inhibition level Zcut (here 50%) to the contour (red) for dose-additivity. The combination index CI = (CX/ICX) + (CY/ICY) measures the fractional shift (black arrow) between the most potent mixture’s doses CX,CY and the single agents’ inhibitory concentrations ICX,ICY. In this example, to reach 50% inhibition, only 4 μM of Drug A and 2 μM of Drug B were required in combination, compared to >41 μM and >34 μM for the single agents. (c) Selectivity is determined from the responses in two assays (“test” and “ctrl”). Single agent (horizontal frames) and fixed dose ratio combination curves (diagonal frames) are extracted from both dose matrices. For Zcut, effective concentrations Ctest,Cctrl (top dose if agents don’t reach Zcut) are determined in both assays (colors match frames in matrices) for all extracted curves, and the selectivity index SI = log10(Cctrl/Ctest) measures potency shifts between assays, where SI = 1 implies a tenfold potency ratio favoring the test assay. The synergistic selectivity for a single combination can be described using ΔSI = SIcombSIagent or ΔCI = CIctrlCItest based on the most selective diagonal curve and the most effective single agent in the test assay. (d) The selectivity bias was determined by comparing SI shifts across many combinations. To avoid spurious correlations due to noise, each test matrix was split into independent copies (see Methods), one to calculate SI and the other for S. The SI distributions across the screen were compared for all combinations (green distribution) and those with S > Scut (green), and the selectivity bias B is measured as the difference between the mean SI values for the two distributions. For reference, we also show the SI distributions of the more effective single agent in black.
Figure 2
Figure 2
Simulations of selective synergies in Escherichia coli metabolism, averaged by functional category. (a) E. coli growth was simulated under aerobic (minimal acetate) and fermentation (minimal glucose) conditions. Inhibitors were applied by restricting the maximum flux rate through target enzymes, over a series of six concentrations chosen to sample each inhibitor’s transition to activity. The average inhibitor responses for each pathway are shown for each condition (diamonds), along with the average SI (squares) between both conditions. Combinations were simulated as a fixed-ratio series by summing the concentrations of each constituent inhibitor, and the average SI at Zcut = max(Ztest)/2 is displayed for each pair of pathways (circles). The combinations selectively highlight the citric acid cycle for aerobic conditions and pyruvate metabolism under fermentation. (b) A plot of S vs. SI shows a correlation between synergy and selectivity with the most synergistic combinations (S > 1) having higher-than-average SI values. (c) Comparing the SI distributions of the most synergistic combinations (red) to all combinations (green) and the selectivity distribution of the more selective inhibitor in each combination (black) shows a strong bias towards more selectivity for the synergies. This selectivity bias B is quantified as the difference between the average SI values for synergistic and unfiltered combinations. The value found here, Bfwd = 0.596±0.005, with Brev = 0.894±0.007 for the “reverse” aerobic – ferment comparison (Suppl. Note 2), represents a fourfold potency increase for the top ~1% of synergies.
Figure 3
Figure 3
Selectivity bias for thirteen sets of combination data focused on six disease areas. The table shows the “test” and “control” assays corresponding to each comparison, the number of single agents Nagent or combinations Ncomb tested, the number Ncopy of combinations with independent replicates, and the aspect ratio “Aspec” of the agent lists that were combined. Also shown are the sampling “Dens” (dose matrix size, * when sparse), with the average activity Zagent and selectivity index SIagent across the single agents. For each screen, all pairs of assays were compared, in “forward” (circles, filled when aligned with a therapeutic objective) and “reverse” (diamonds) order relative to the assay designations listed. Each combination’s SI value was calculated at Zcut = max(Ztest)/2, and the top 5% of synergies for each test assay were used to determine a selectivity bias. Error bars represent 95% confidence with a sequential multiple hypothesis adjustment to account for all assay comparisons in each screen. Weighted by these errors, the consensus selectivity bias is 0.104±0.010 (0.214±0.021 for therapeutically aligned pairs). The synergistic combinations have statistically more positive selectivity, with some screens showing more than threefold potency shifts.
Figure 4
Figure 4
Examples of therapeutically and mechanistically selective synergies, showing the control (left) and test (center) matrices, along with the test isobologram (right). Selectivity is measured using ΔCI and ΔSI at 50% effect. (a) Ribavirin and disulfiram are each active on metabolic targets (inosine monophosphate dehydrogenase for ribavirin, and mitochondrial aldehyde dehydrogenase 2 for disulfiram) at high doses in both primary smooth muscle cell viability and Staphylococcus aureus proliferation assays, but the strong antibacterial synergy is completely absent in the human cell toxicity model. (b) In cancer cell lines, the synergy between camptothecin and LY 294002 (b) is stronger against lung-derived H460 than Colo-205 colon cells. In the screen from which this combination was drawn, we found evidence of synergy in H460 for 21/32 TOP + PI3K (targeting topoisomerase with phosphoinositide 3 kinase) combinations tested, 12 of which had similar levels of selectivity over Colo-205 (data not shown), suggesting that the synergy results from coordinated activity on each drug’s primary target. (c) For all of our example combinations, the single drugs have unrelated indications or modes of action, suggesting that multi-target mechanisms predominate. The remaining examples are detailed in Suppl. Note 4.
Figure 5
Figure 5
Selective synergy between glucocorticoids (GC) and tricyclic anti-depressants (TCA). (a) The synergy against TNFα secretion in PBMCs remains when related drugs are substituted (Suppl. Note 4), so the synergy operates via the primary drug targets. Moreover, 59 of 63 combinations we have tested in this assay on these targets at sufficient concentrations were also synergistic (S > 5 standard errors, data not shown). (b) Mechanistically, GCs activate the glucocorticoid receptor (GCR) which suppresses inflammatory signaling. In response to stress, lymphocytes secrete catecholamine hormones, such as norepinephrine (NE), which suppress inflammatory signaling via beta-adrenergic receptors (ADRB2). TCAs block NE transporters (SLC6A2), which increases extracellular NE levels, with a synergistic anti-inflammatory effect when combined with GCs. Directly adding NE and modulating ADRB2 in combination with GC confirms the role of this pathway in the GC-TCA synergy (Suppl. Note 4). The in vivo therapeutic selectivity arises because while GCR, SLC6A2 and ADRB2 are co-expressed in lymphoid cells, ADRB2 is expressed 3–10 fold lower in tissues such as liver and pituitary that mediate major GC-associated adverse effects, weakening the NE-mediated pathway and attenuating the GC-TCA synergy. In rats, the combination of nortriptyline with another GC that is widely used for asthma treatment, budesonide, was tested in an asthma model via ovalbumin challenge (c). The combination at individually sub-therapeutic doses was able to restore lung infiltration by eosinophils to levels seen with high-dose dexamethasone or unchallenged rats (ANOVA p < 0.05 over single agents). Anti-inflammatory synergy with prednisolone was also confirmed in a rat pain model (Suppl. Note 4). By contrast, rat liver toxicity (d), modeled by a corticosteroid side effect marker tyrosine aminotransferase (TAT), showed elevated expression only for high dose prednisolone (ANOVA p < 0.05), while the effects at doses showing anti-inflammatory synergy were consistent with or lower than negative controls. In vivo data are detailed in Tab. S8.

References

    1. Hopkins AL. Network pharmacology: the next paradigm in drug discovery. Nat Chem Biol. 2008;4:682–90. - PubMed
    1. Hughes B. 2007 FDA drug approvals: a year of flux. Nat Rev Drug Discov. 2008;7:107–109. - PubMed
    1. Hartman JLt, Garvik B, Hartwell L. Principles for the buffering of genetic variation. Science. 2001;291:1001–1004. - PubMed
    1. Stelling J, Sauer U, Szallasi Z, Doyle FJ, 3rd, Doyle J. Robustness of cellular functions. Cell. 2004;118:675–685. - PubMed
    1. Kitano H. A robustness-based approach to systems-oriented drug design. Nat Rev Drug Discov. 2007;6:202–210. - PubMed

Publication types

Substances

LinkOut - more resources