. 2009 Jul;4(7):445-50.
doi: 10.1038/nnano.2009.152. Epub 2009 Jun 21.

Towards single-molecule nanomechanical mass spectrometry

Affiliations

Towards single-molecule nanomechanical mass spectrometry

A K Naik et al. Nat Nanotechnol. 2009 Jul.

Abstract

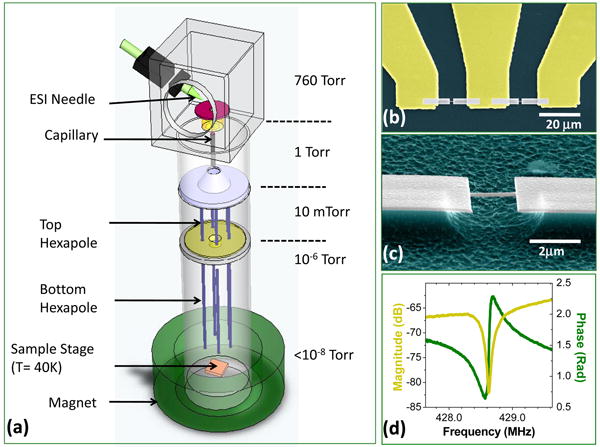
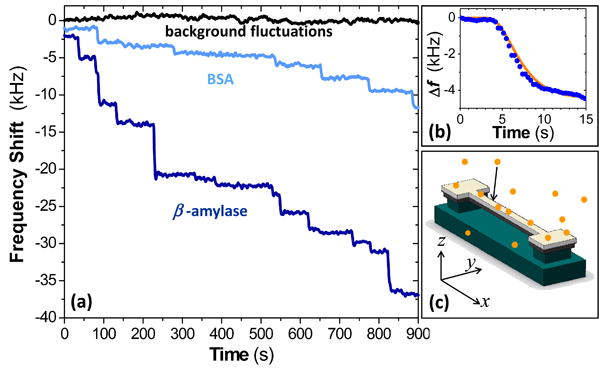
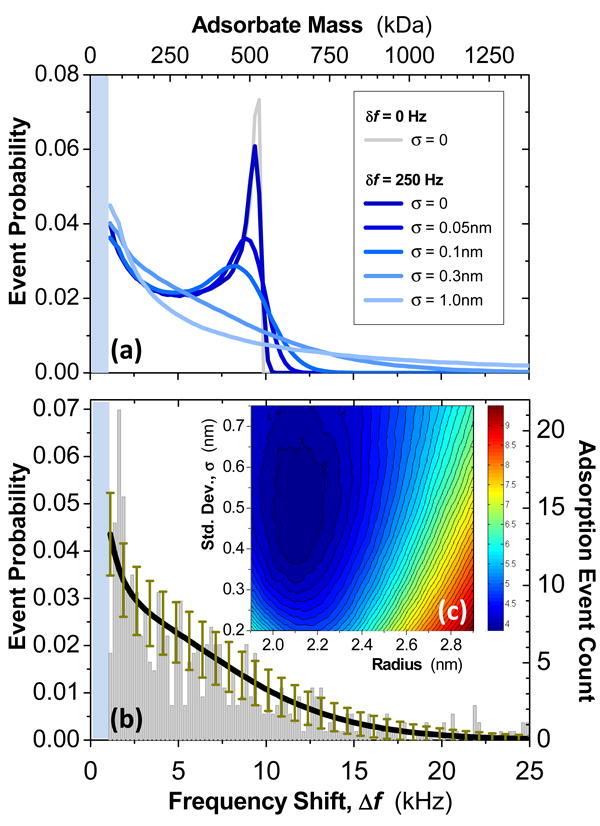
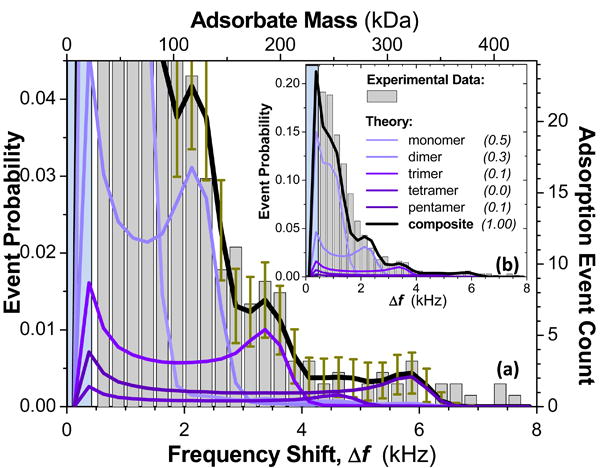
Mass spectrometry provides rapid and quantitative identification of protein species with relatively low sample consumption. The trend towards biological analysis at increasingly smaller scales, ultimately down to the volume of an individual cell, continues, and mass spectrometry with a sensitivity of a few to single molecules will be necessary. Nanoelectromechanical systems provide unparalleled mass sensitivity, which is now sufficient for the detection of individual molecular species in real time. Here, we report the first demonstration of mass spectrometry based on single biological molecule detection with a nanoelectromechanical system. In our nanoelectromechanical-mass spectrometry system, nanoparticles and protein species are introduced by electrospray injection from the fluid phase in ambient conditions into vacuum, and are subsequently delivered to the nanoelectromechanical system detector by hexapole ion optics. Precipitous frequency shifts, proportional to the mass, are recorded in real time as analytes adsorb, one by one, onto a phase-locked, ultrahigh-frequency nanoelectromechanical resonator. These first nanoelectromechanical system-mass spectrometry spectra, obtained with modest mass sensitivity from only several hundred mass adsorption events, presage the future capabilities of this approach. We also outline the substantial improvements that are feasible in the near term, some of which are unique to nanoelectromechanical system based-mass spectrometry.


Figures

Figure 1
Figure 1. First-generation NEMS-MS system
(a) Simplified schematic of the experimental configuration (not to scale), showing the fluid-phase electrospray ionization and injection, the system's two-stage differential pumping, and its two-stage ion optics. (b, c) Progressively magnified scanning electron micrographs showing one of the doubly-clamped beam NEMS devices used in these experiments. It is embedded in a nanofabricated three-terminal UHF bridge circuit. (d) Magnitude and phase of the UHF NEMS resonator's response displaying a prominent fundamental-mode resonance near 428MHz.
Figure 2
Figure 2. Real-time records of single-molecule adsorption events upon a NEMS mass sensor
(a) This raw experimental data shows the distinctly-different, precipitous resonance frequency shifts of the NEMS during ESI-induced adsorption of bovine serum albumin (BSA, 66kDa) and β-amylase (200kDa). Each frequency jump downward is due to an individual protein adsorption event on the NEMS mass sensor. The height of each frequency jump is a convolved function of the mass of the protein that has adsorbed, and its position of adsorption upon the NEMS. (b) Raw data from a typical discrete event (blue dots), and a non-linear least square fit to the system's response (orange line), based on the temporal response function of the control loop. (c): Schematic illustrating single-molecule adsorption events on a NEMS resonator (orange circles), and the coordinate system used to define its position-dependent mass responsivity. The device itself is comprised of silicon carbide (dark grey) with a metallic layers (light gray) on top. The silicon substrate (green) beneath the SiC is etched to release (suspend) the doubly clamped beam.
Figure 3
Figure 3. NEMS mass spectrometry of a gold nanoparticle dispersion
(a) Theoretically expected event probabilities versus frequency-jump amplitudes are shown for “nominal” 2.5nm radius Au nanoparticles (modeled assuming a 2.15 nm mean radius), delivered with an average flux that is uniformly distributed over a doubly-clamped beam having peak mass responsivity ∼12Hz/zg. Traces show expected results for a monodisperse ensemble of particles, as well as for several dispersions (characterized by their radius standard deviations), for the cases of perfect (0Hz) and experimentally-relevant (250Hz) frequency resolutions. (b) Experimentally obtained histogram of adsorption event probabilities versus frequency-jump amplitude for electrosprayed gold nanoparticles, and the expected curve for a average radius of 2.15nm and a radial dispersion of 0.375nm (black trace). Error bars (dark yellow) display the theoretically-expected deviations corresponding to 544 adsorption events, as registered in this experiment. (c) Contour plot showing the residues for least-square fits to the experimental data using radius and radial dispersion as the fitting parameter. These data establish the average radius and size dispersion for the 544 nanoparticles measured.
Figure 4
Figure 4. NEMS mass spectrometry of proteins
NEMS-MS of bovine serum albumin (BSA) enabled by adsorption-event probability analysis. Experimentally obtained frequency-jump data are binned into 250Hz histograms commensurate with the experimental mass sensitivity. Applying a 2σ detection criterion, we reject data below 500Hz (blue-shaded regions; see text). (a) Expanded view of the low-event-probability region displaying a clearly detailed decomposition of the simultaneous contributions from oligomers. The theoretical composite curve (grey) is a weighted superposition of adsorption probabilities of the intact monomer and a family of its oligomers deterministically calculated by a least-squares process similar to that of Figure 3 (Supplementary Information). (b) Full view of entire data set for the 578 BSA molecular adsorption events recorded in this experiment. The numerically-determined best-fit weighting coefficients for the composite curve are displayed in the legend.

Comment in

References

    1. Roukes ML. Nanoelectromechanical systems face the future. Phys World. 2001 Feb;14:25–31.
    1. Naik A, et al. Cooling a nanomechanical resonator with quantum back-action. Nature. 2006;443:193–196. - PubMed
    1. Burg TP, Manalis SR. Suspended microchannel resonators for biomolecular detection. Appl Phys Lett. 2003;83:2698–2700.
    1. LaHaye MD, Buu O, Camarota B, Schwab KC. Approaching the quantum limit of a nanomechanical resonator. Science. 2004;304:74–77. - PubMed
    1. Thompson JD, et al. Strong dispersive coupling of a high-finesse cavity to a micromechanical membrane. Nature. 2008;452:72–75. - PubMed

Publication types

MeSH terms

Substances