. 2009 Jul;7(7):e1000149.
doi: 10.1371/journal.pbio.1000149. Epub 2009 Jul 7.

Regulated fluctuations in nanog expression mediate cell fate decisions in embryonic stem cells

Affiliations

Regulated fluctuations in nanog expression mediate cell fate decisions in embryonic stem cells

Tibor Kalmar et al. PLoS Biol. 2009 Jul.

Abstract

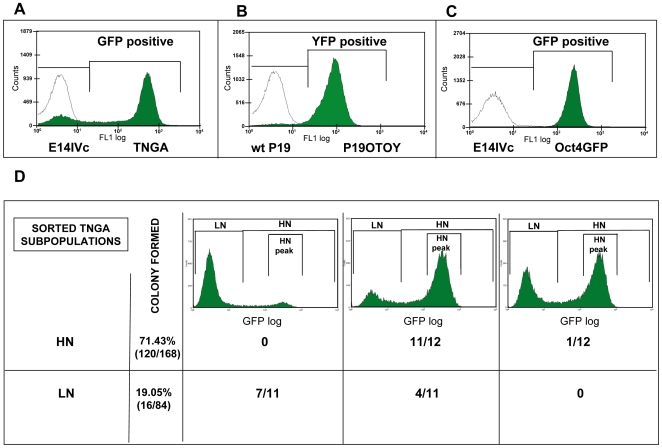
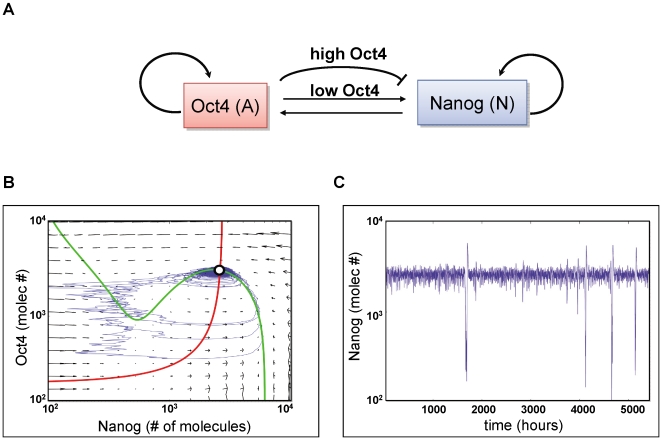
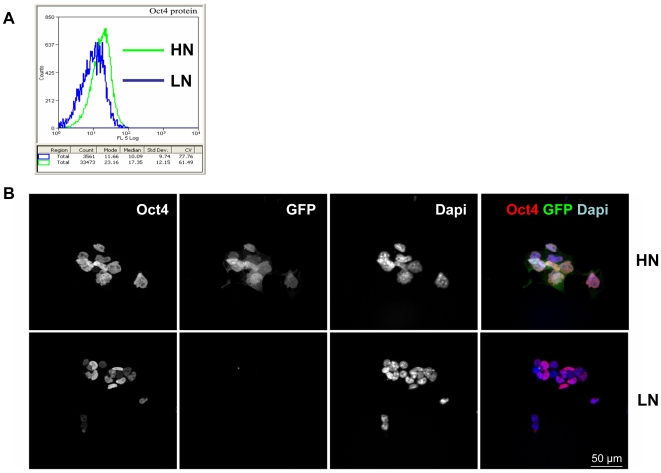
There is evidence that pluripotency of mouse embryonic stem (ES) cells is associated with the activity of a network of transcription factors with Sox2, Oct4, and Nanog at the core. Using fluorescent reporters for the expression of Nanog, we observed that a population of ES cells is best described by a dynamic distribution of Nanog expression characterized by two peaks defined by high (HN) and low (LN) Nanog expression. Typically, the LN state is 5%-20% of the total population, depending on the culture conditions. Modelling of the activity of Nanog reveals that a simple network of Oct4/Sox2 and Nanog activity can account for the observed distribution and its properties as long as the transcriptional activity is tuned by transcriptional noise. The model also predicts that the LN state is unstable, something that is born out experimentally. While in this state, cells can differentiate. We suggest that transcriptional fluctuations in Nanog expression are an essential element of the pluripotent state and that the function of Sox2, Oct4, and Nanog is to act as a network that promotes and maintains transcriptional noise to interfere with the differentiation signals.


Conflict of interest statement

The authors have declared that no competing interests exist.

Figures

Figure 1
Figure 1. A dynamically stable distribution of Nanog expression in ES and EC cell populations.
The steady-state distribution of Nanog reporters (TNGA, P19OTOY) and Oct4 reporter (Oct4GFP) in serum+LIF culture condition (statistical analysis performed using at least four independent experiments, see Material and Methods) (A–C) and distributions generated from single TNGA cells (D). (A)The steady-state GFP expression profile of transgenic TNGA (Nanog-GFP knock-in) ES cell line (green) compared with parental E14IVC cell line (unfilled), which shows the level of autofluorescence in this cell line. TNGA cells exhibit a GFP-negative peak with a mode value of 7.69±2.05, and a GFP-positive peak with a mode value of 391.70±63.49. (B) YFP expression profile of transgenic P19OTOY EC cell line (green) compared with the P19 parental cell line (unfilled). In the serum+LIF condition, 3.14±0.36% of the whole cell population fall in the YFP-negative range (peak with a mode value of 14.37±8.09), whereas 96.90±0.34% are YFP-positive (peak with a mode value of 124.00±25.20). wt, wild type. (C) The steady-state GFP profile of transgenic Oct4GFP ES cell line (green) compared with the parental E14IVC cell line (unfilled). At any given time, only 0.24%±0.08% of the whole cell population is GFP negative, while 99.76±0.08% is GFP-positive (peak with a mode value of 84.97±12.55). (D) GFP-positive (HN) or -negative (LN) single cells were isolated from a steady-state TNGA cell culture and subcultured individually for 11 additional days in normal growth conditions. From the 168 seeded GFP-positive cells, 120 formed colonies; whereas only 16 out of the isolated 84 GFP-negative cells did so. Twelve independent colonies from each experiment were randomly picked and FACS scanned to assess their profiles of Nanog-GFP expression. Regardless of the initial GFP status of the individual cells, when they formed a colony, most of them reconstituted the original dual-peak profile, though the relative proportions of cells in the dual peaks varied. We observed three main types of expression profiles generated by the single-cell–derived clones, which appeared with different frequencies in the case of the two isolated subpopulations, as indicated. The LN cells were somewhat biased towards the original profile, perhaps reflecting that some of them have made a decision to differentiate (see main text).
Figure 2
Figure 2. The position of a cell in the distribution determines its developmental potential.
TNGA cells with different levels of Nanog-reporter expression (low Nanog, LN, or high Nanog, HN, respectively) have different gene expression profiles ([A] and see main text) and respond differently to the same differentiation cues (B). (A) TNGA ES cells were sorted as LN and HN, based on their Nanog-reporter expression levels, and total RNA was purified. Semiquantitative RT-PCR analyses were performed to detect markers associated with both ES cell pluripotency and differentiation; the transcripts in each population and the cycle number are indicated in the figure. There are no significant differences between the subpopulations in the case of Oct4 expression, but only LN cells express detectable level of FGF5, a gene associated with differentiation , indicating that the LN population is primed for differentiation. (B) A TNGA ES cell population was sorted into LN and HN subpopulations and subjected to neural differentiation conditions (reduced serum [5%], no added LIF, FGF2 [20 ng/ml] and retionic-acid [RA] [10 µM]) for 3 d. As a control, an aliquot of these subpopulations was kept in culture with 10% serum with LIF. In the case of LN cells, the induced differentiation greatly reduced the number of cells reaching HN state (16% vs. 70%). On the other hand, the differentiation regime reduced the overall number of cells in the HN state (from 97% to 89%) but led to a noticeable shift in the medial fluorescence of Nanog-GFP associated with the differentiation.
Figure 3
Figure 3. A model of pluripotency as a noise-driven excitable system.
A minimal circuit module represents the activity of the pluripotency network as a noise driven excitable system (A–C). (A) This gene circuit contains the known mutual and self-regulatory interactions between Nanog (N) and Oct4 (A), and also includes a negative feedback of the network on Nanog expression. (B) The dynamic behaviour of the GRN underlying this circuit can be traced in phase space. The movement of a cell in phase space is determined by the relative concentration of Nanog and Oct4, and shows that the system has a single stable steady state (white circle), corresponding to high levels of both Nanog and Oct4. The topology of the phase space, as dictated by the location of the N (green) and A (red) nullclines and the slope field (grey vectors in the background), allows that small perturbations of the steady state generate excursions in phase space towards regions where the level of Nanog is low. Since there is no proper steady state in this region, after a deterministic time, the cell is forced to return spontaneously to the state in which Nanog is high, driven by the structure of the network (blue line). A consequence of this dynamical behaviour is that Oct4 levels are more variable in the low-level Nanog state, where trajectories fluctuate strongly along the left branch of the N nullcline, than in the high-level Nanog state, where the cell spends most of the time near the steady state. (C) The corresponding time trace generated after small perturbations of the steady state in the case of Nanog. Following a rare, sudden decrease in the number of Nanog molecules, a very fast return to the HN steady-state level could be observed.
Figure 4
Figure 4. Different behaviour of subpopulations with different levels of Nanog.
Dynamics of Nanog-GFP expression in subpopulations of EC (P19OTOY) and ES (TNGA) cells and in embryoid body (EB) expressing different levels of Nanog-FP (A–C). (A) P19OTOY cells with different YFP expression levels (R7, R8, and R9 as indicated) were sorted by FACS. The isolated cells were subcultured for 24 h or for 4 d, and the resulting populations were rescanned. Note that after 24 h, approximately 46% of the formerly LN (R7) cells became positive, whereas after 4 d, approximately 72% of them express higher than autofluorescence level of YFP. In the case of the R8 and R9 (originally YFP-positive, HN) cells, the changes are minor and consistent with the dynamics of the population as a whole. (B) TNGA ES cells expressing GFP at different levels (R7, R8, and R9) were selected and FACS sorted as indicated. The isolated cells were subcultured for 2 d with samples taken every 24 h and rescanned. More than 28% and 38% of the LN (R7) population transit to the HN state in 24 h and 48 h, respectively, whereas less than 8% of R8 or R9 cells became GFP-negative during the same period of time. (C) Embryoid body (EB) formation from isolated LN and HN TNGA ES cells after 24 h. In the case of sorted LN cells, some of them in the EB express GFP, whereas in the case of EB derived from HN cells, the vast majority of the cells maintain GFP expression. The variegated expression in the EB derived from the LN cells is consistent with a stochastic transition from LN to HN.
Figure 5
Figure 5. Single-cell dynamics of the transitions between the LN and HN states.
TNGA cells from different regions of the distribution were sorted, plated, and then allowed to recover for 24 h before filming. They were then filmed for the indicated periods of time (for details, see Materials and Methods). (A) Sorted LN cells were filmed over 2 d. All cells are initially negative for GFP (at 0 h), but over the course of 24 h, individual cells begin to express Nanog-GFP. Notice that there is no pattern to the onset of expression and that by 24 h, a large proportion of the cells in this cluster are in the HN state. Images are taken from Video S1. Notice that this behaviour accounts for the observations of the experiments referred to in Figure 4B. (B) Similar protocol as in (A) but in this case, cells were selected from the plateau between the LN and the HN states and were filmed over 2 d to reveal the stochastic nature of the decision to move between the HN and LN states. The daughters of the cell labelled with a white arrow at 0 h can be seen to follow different paths: one of them up-regulates Nanog-GFP (yellow arrows), whereas the other down-regulates Nanog-GFP (black arrows). Images are derived from Video S2.
Figure 6
Figure 6. Expression of Oct4 in sorted HN and LN TNGA cells.
(A) Expression of Oct4 in TNGA cells sorted for HN (green line) and LN (blue line). Cells were fixed and stained for Oct4 (for details, see Materials and Methods) prior to FACS analysis. Oct4 expression is more uniform and has a higher median in the HN population than in the LN population. (B) TNGA cells were sorted into HN and LN populations and stained for Oct4 (red channel) and DAPI (blue channel). The green channel shows the expression of the Nanog-GFP reporter. The expression of Oct4 is higher and more uniform in the HN than in the LN cells, consistent with the FACS profile shown in (A). There are apparent and reproducible differences in the size of the cells and the nuclei of the two populations. Bar indicates 50 µm.
Figure 7
Figure 7. Stochastic simulation of the GRN associated with pluripotency.
(A, C, and E) Profiles, resulting from stochastic simulations of the GRN shown in Figure 3, emerging from single cells with increasing levels of noise. (B, D, and F) Trajectories of single cells in the regimes indicated above. For details of the model, see Protocol S1. Notice that increasing the noise (by reducing the effective volume of the cell) increases the width of the peak of low expression.
Figure 8
Figure 8. Parameter sensibility analysis of the model.
Relative changes in the fraction of LN cells (A) and in the dwell time of cells in the LN (B) with respect to their value in the base excitable regime when all parameters of the deterministic NOS model are increased (yellow) and decreased (green) by 20% over its base (excitable) level. For details of the parameters, see Protocol S1. Changes in the levels of noise are created by altering the effective volume of the cell in the simulation. This results in alterations in the effective concentration of the molecules, which will have an impact on the stochasticity of the biochemical processes. The behaviour of the system is very robust, with a few exceptions highlighted in the figure and discussed in the text.

References

    1. Evans MJ, Kaufman MH. Establishment in culture of pluripotential cells from mouse embryos. Nature. 1981;292:154–156. - PubMed
    1. Martin GR. Isolation of a pluripotent cell line from early mouse embryos cultured in medium conditioned by teratocarcinoma stem cells. Proc Natl Acad Sci U S A. 1981;78:7634–7638. - PMC - PubMed
    1. Brook FA, Gardner RL. The origin and efficient derivation of embryonic stem cells in the mouse. Proc Natl Acad Sci U S A. 1997;94:5709–5712. - PMC - PubMed
    1. Smith AG. Embryo-derived stem cells: of mice and men. Annu Rev Cell Dev Biol. 2001;17:435–462. - PubMed
    1. Beddington RS, Robertson EJ. An assessment of the developmental potential of embryonic stem cells in the midgestation mouse embryo. Development. 1989;105:733–737. - PubMed

Publication types

MeSH terms