

Metabolic characterization of a mouse deficient in all known leptin receptor isoforms
- PMID: 19582570
- PMCID: PMC2813927
- DOI: 10.1007/s10571-009-9427-x
Metabolic characterization of a mouse deficient in all known leptin receptor isoforms
Abstract
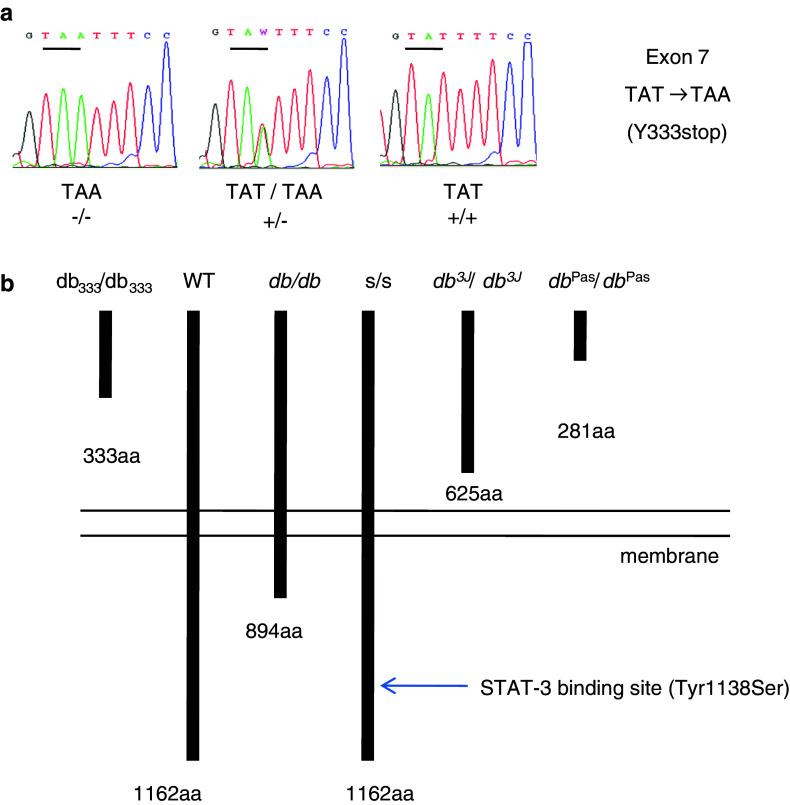
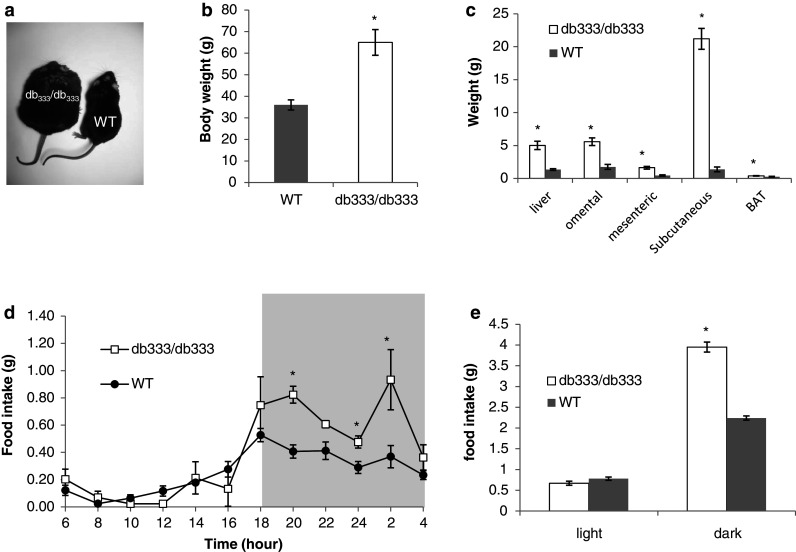
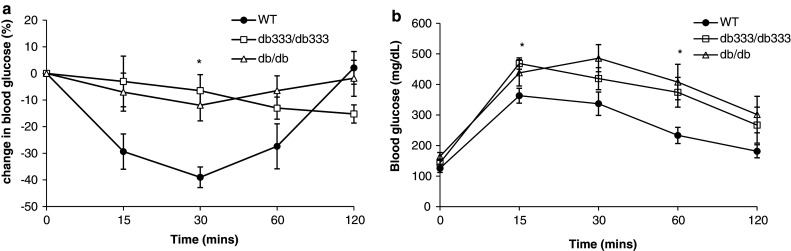
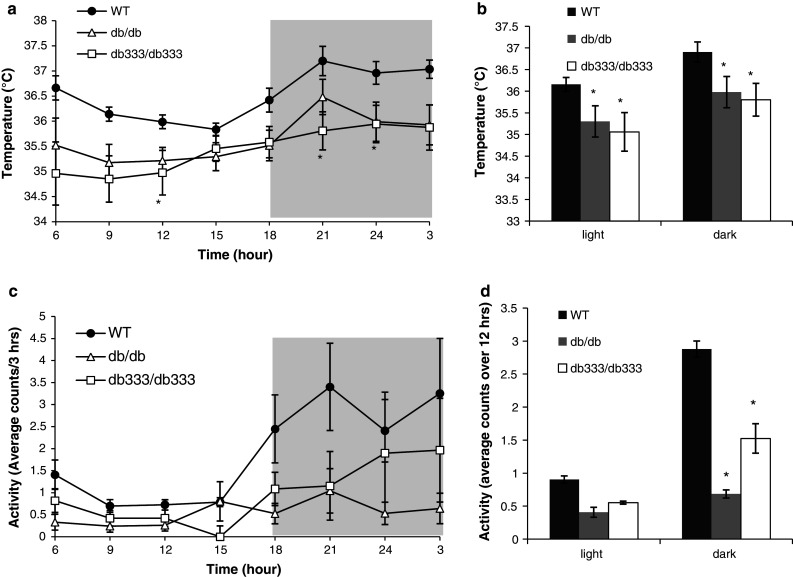
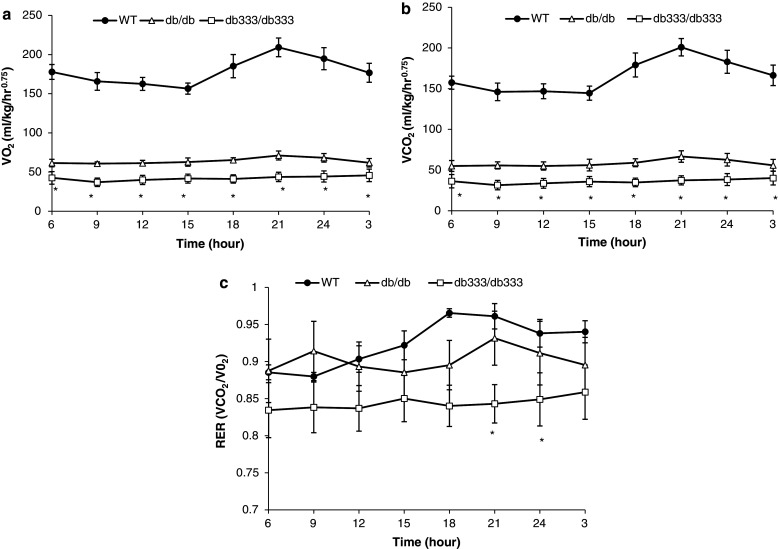
We have characterized a newly generated mouse model of obesity, a mouse strain deficient in all five previously described leptin receptor isoforms. These transgenic mice, named the db (333)/db (333) mice, were identified from an ENU mutagenesis screen and carry a point mutation in the seventh exon of the db gene encoding the leptin receptor, resulting in a premature stop codon (Y(333)Stop) and gene product that lacks STAT signaling domains. db (333)/db (333) mice have a morbidly obese phenotype, with body weights diverging from wild type as early as 4 weeks of age (P < 0.05). To determine the contribution of the short isoforms of the leptin receptor in this metabolic phenotype, we performed an extensive metabolic characterization of the db (333)/db (333) mouse in relation to the well-characterized db/db mouse lacking only the long form of the leptin receptor. db (333)/db (333) mice have similar endocrine and metabolic parameters as previously described in other leptin receptor transgenic mice including db/db mice that lack only the long isoform of the leptin receptor. However, db (333)/db (333) mice show a subtle trend toward higher body weight and insulin levels, lower oxygen, carbon dioxide production, respiratory exchange ratio (RER), and temperature than db/db mice suggesting the short isoforms may play an additional role in energy homeostasis.
Figures


Similar articles
-
Transgenic complementation of leptin-receptor deficiency. I. Rescue of the obesity/diabetes phenotype of LEPR-null mice expressing a LEPR-B transgene.Diabetes. 2001 Feb;50(2):425-35. doi: 10.2337/diabetes.50.2.425. Diabetes. 2001. PMID: 11272157
-
Temperature dependence of O2 consumption; opposite effects of leptin and etomoxir on respiratory quotient in mice.Obesity (Silver Spring). 2006 Apr;14(4):673-82. doi: 10.1038/oby.2006.76. Obesity (Silver Spring). 2006. PMID: 16741269
-
A spontaneous leptin receptor point mutation causes obesity and differentially affects leptin signaling in hypothalamic nuclei resulting in metabolic dysfunctions distinct from db/db mice.Mol Metab. 2019 Jul;25:131-141. doi: 10.1016/j.molmet.2019.04.010. Epub 2019 Apr 25. Mol Metab. 2019. PMID: 31076350 Free PMC article.
-
Bilirubin increases insulin sensitivity in leptin-receptor deficient and diet-induced obese mice through suppression of ER stress and chronic inflammation.Endocrinology. 2014 Mar;155(3):818-28. doi: 10.1210/en.2013-1667. Epub 2014 Jan 1. Endocrinology. 2014. PMID: 24424052 Free PMC article.
-
Leptin and the pituitary.Pituitary. 2001 Jan-Apr;4(1-2):15-23. doi: 10.1023/a:1012978525492. Pituitary. 2001. PMID: 11824504 Review.
Cited by
-
Aminoglycosides, but not PTC124 (Ataluren), rescue nonsense mutations in the leptin receptor and in luciferase reporter genes.Sci Rep. 2017 Apr 21;7(1):1020. doi: 10.1038/s41598-017-01093-9. Sci Rep. 2017. PMID: 28432296 Free PMC article.
-
Variants in the LEPR gene are nominally associated with higher BMI and lower 24-h energy expenditure in Pima Indians.Obesity (Silver Spring). 2012 Dec;20(12):2426-30. doi: 10.1038/oby.2012.159. Epub 2012 Jun 22. Obesity (Silver Spring). 2012. PMID: 22810975 Free PMC article.
-
A Novel Diabetic Mouse Model for Real-Time Monitoring of Clock Gene Oscillation and Blood Pressure Circadian Rhythm.J Biol Rhythms. 2019 Feb;34(1):51-68. doi: 10.1177/0748730418803719. Epub 2018 Oct 2. J Biol Rhythms. 2019. PMID: 30278816 Free PMC article.
-
Random mutagenesis of the mouse genome: a strategy for discovering gene function and the molecular basis of disease.Am J Physiol Gastrointest Liver Physiol. 2011 Jan;300(1):G1-11. doi: 10.1152/ajpgi.00343.2010. Epub 2010 Oct 14. Am J Physiol Gastrointest Liver Physiol. 2011. PMID: 20947703 Free PMC article. Review.
-
Leptin augments IL-13-induced airway eotaxins and submucosal eosinophilia in obesity-associated asthma.J Allergy Clin Immunol. 2025 Mar;155(3):819-833.e10. doi: 10.1016/j.jaci.2024.10.039. Epub 2024 Nov 22. J Allergy Clin Immunol. 2025. PMID: 39581293
References
-
- Ahima RS, Prabakaran D et al (1996) Role of leptin in the neuroendocrine response to fasting. Nature 382(6588):250–252 - PubMed
-
- Aubert R, Herzog J et al (1985) Description of a new model of genetic obesity: the dbPas mouse. J Nutr 115(3):327–333 - PubMed
-
- Bates SH, Myers MG Jr (2003) The role of leptin receptor signaling in feeding and neuroendocrine function. Trends Endocrinol Metab 14(10):447–452 - PubMed
-
- Bates SH, Dundon TA et al (2004) LRb-STAT3 signaling is required for the neuroendocrine regulation of energy expenditure by leptin. Diabetes 53(12):3067–3073 - PubMed
Publication types
MeSH terms
Substances
Grants and funding
LinkOut - more resources
Full Text Sources
Molecular Biology Databases
Miscellaneous
