. 2009 Jul 7:10:301.
doi: 10.1186/1471-2164-10-301.

Systemic treatment of xenografts with vaccinia virus GLV-1h68 reveals the immunologic facet of oncolytic therapy

Affiliations

Systemic treatment of xenografts with vaccinia virus GLV-1h68 reveals the immunologic facet of oncolytic therapy

Andrea Worschech et al. BMC Genomics. .

Abstract

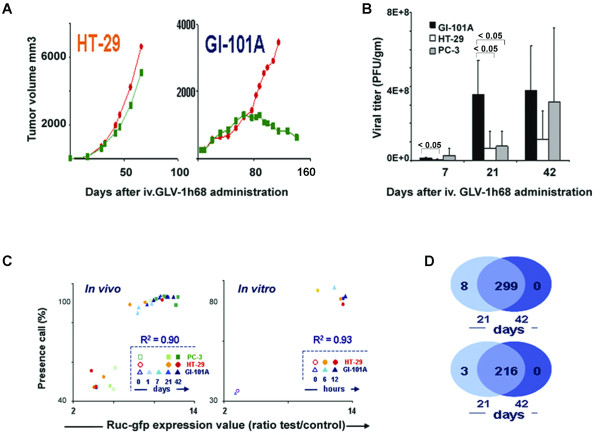
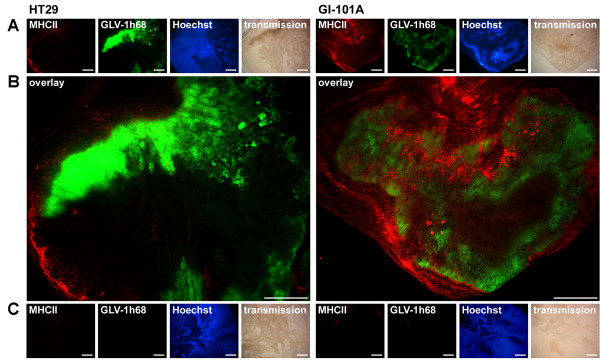
Background: GLV-1h68 is an attenuated recombinant vaccinia virus (VACV) that selectively colonizes established human xenografts inducing their complete regression.

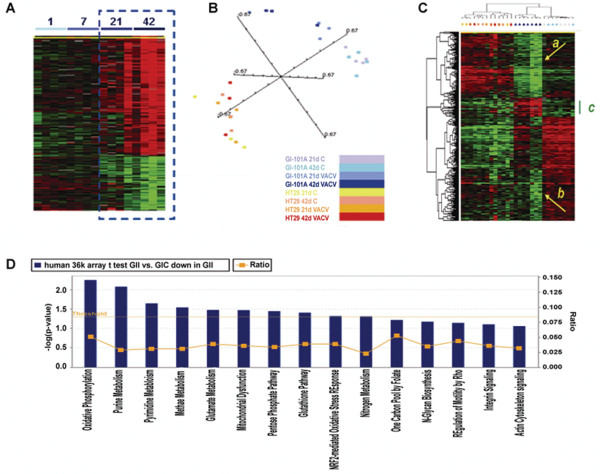
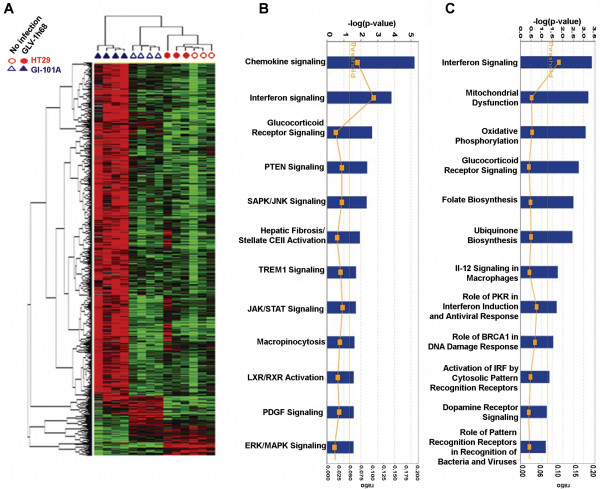
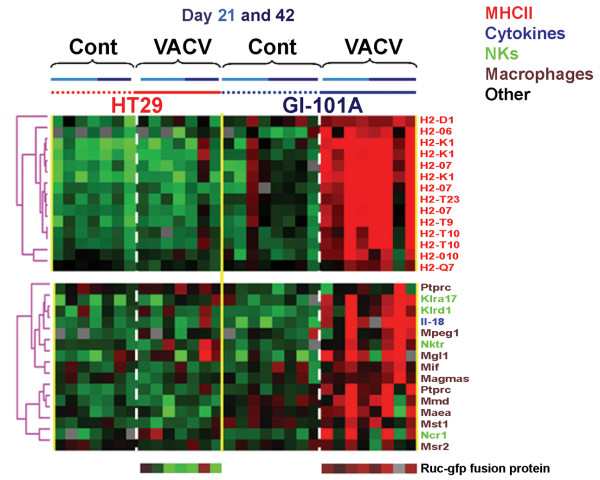
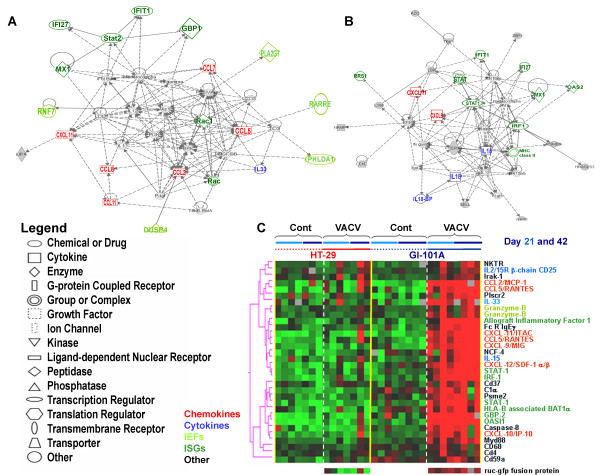
Results: Here, we explored xenograft/VACV/host interactions in vivo adopting organism-specific expression arrays and tumor cell/VACV in vitro comparing VACV replication patterns. There were no clear-cut differences in vitro among responding and non-responding tumors, however, tumor rejection was associated in vivo with activation of interferon-stimulated genes (ISGs) and innate immune host's effector functions (IEFs) correlating with VACV colonization of the xenografts. These signatures precisely reproduce those observed in humans during immune-mediated tissue-specific destruction (TSD) that causes tumor or allograft rejection, autoimmunity or clearance of pathogens. We recently defined these common pathways in the "immunologic constant of rejection" hypothesis (ICR).

Conclusion: This study provides the first prospective validation of a universal mechanism associated with TSD. Thus, xenograft infection by oncolytic VACV, beyond offering a promising therapy of established cancers, may represent a reliable pre-clinical model to test therapeutic strategies aimed at modulating the central pathways leading to TSD; this information may lead to the identification of principles that could refine the treatment of cancer and chronic infection by immune stimulation or autoimmunity and allograft rejection through immune tolerance.


Figures

Figure 1
Figure 1
Characterization of human xenografts and Vaccinia Virus signatures. (A) Representative growth curves (n = 8 animals) for 2 xenografts from HT-29 and GI-101A cell lines; red dots represent control, green boxes the post treatment groups; for further details about the xenograft model refer to references [9,13]. (B) Viral titer (PFU/gram of xenograft; n = 4) comparing the permissivity of 3 xenografts derived from GI-101A, HT-29 and PC-3 cell line whose responsiveness is under characterization 7, 21 and 42 days after GLV-1h68 administration. (C, left) Scatter plot correlating the level of Renilla luciferase-Aequorea green fluorescent protein messenger RNA expression with the presence call of probes above the set threshold level for the VACV expression array platform. VACV gene expression in non-infected PC-3, HT-29 and GI-101A xenografts was compared to infected xenografts 1, 7 (GI-101A only), 21 and 42 days before. High presence call (> 40%) in the non-infected xenografts could be expected due to the large number of mouse and human housekeeping genes present in the array platform); R2 value refers to the correlation between RUC-GFP expression and number of VACV transcripts significantly up regulated in the same experiment. (C, right) Scatter plot as per panel C, left, comparing in vitro VACV gene expression of GLV-1h68-infected HT-29 and GI-101A cell lines at 6 and 12 hours with controls. (D) A Venn diagram displays the extent of overlap among VACV-specific probes (top) and VACV genes (bottom) differentially expressed by infected GI-101A xenografts at day 21 and 42 compared with day 1 after GLV-1h68 injection.
Figure 2
Figure 2
Human Cancer signatures. (A) Time course analysis of infected GI-101A xenografts (parameters for gene selection; F test p-value < 0.005, 80% presence call, ratio of > 2 and false discovery rate < 0.1). Gene distribution is shown based on 893 genes of 17,500 present in the human cDNA platform that passed the statistical criteria and presented according to Spearman rank correlation. The dashed box outlines the 2 time points most affected by VACV infection. The heat map information is presented according to the central method for normalization [30]. (B) Multiple dimensional scaling based on the 36 k oligo array human platform comparing HT-29 and GI-101 xenografts. (C) Self organizing heat map based on 841 out of 1,073 genes differentially expressed between GI-101A xenografts from infected compared to non-infected mice that passed the standard filter conditions (presence call in at least 80% and at least 3 fold ratio change). HT-29 samples are also represented as a reference, color coding of samples is as per panel (B). The green bar underlines the genes specifically expressed by Gl-101A xenografts from infected animals; the 2 yellow arrows (a) and (b) point at genes who expression was profoundly depressed in xenografts from infected animals. (D) Ingenuity pathway analysis showing canonical pathways significantly down-regulated in GI-101A xenografts at day 41 following GLV-1h68 injection; IPA analysis based on an unpaired, two-tailed Student t test comparing infected to non-infected GI-101A xenografts at day 42 (threshold p2-value < 0.001).
Figure 3
Figure 3
Mouse host's signatures. (A) Self-organizing heat map of mouse genes differentially expressed among the 4 experimental groups (HT-29 and GI-101A xenografts from GLV-1h68-infected or non-infected mice) according to an F test at day 42 after infection. Standard filter was applied (80% presence call, 3 fold ratio cut off) that allowed 819 out of 1,066 genes at day 21 and 1,159 out of 1,471 genes at day 42. IPA of canonical pathways over-induced in infected compared to non-infected GI-101A xenografts at day (B) 21 and (C) 42 based on an unpaired, two-tailed Student t test comparing infected to non-infected GI-101A xenografts (threshold p2-value < (A) 0.001 and (B) 0.0001).
Figure 4
Figure 4
Mouse immune gene signatures. Self-organizing heat map based on genes selected according to macrophage (brown), natural killer cell (light green), cytokine (blue) or major histocompatiblity class II (red) annotations among those up-regulated in GI-101A xenografts excised from VACV-infected animals (Student t test p2-value < 0.001). Genes presented in Figure 6 as representative of the ICR were omitted here to avoid redundancy.
Figure 5
Figure 5
Immunohistochemistry staining of MHC class II positive cells. Scale bars are equal to 1 mm and 10× magnification was applied. (A) 42 days after GLV-1h68 administration HT-29 (left) and GI-101A (right) xenografts were excised, sectioned and labeled for MHCII and vital DNA (Hoechst). In addition, GFP signals from VACV infected cells and transmission images are shown. (B) Overlay of MHCII and GFP signals in HT-29 tumors (left) and GI-101A tumors (right). (C) Uninfected HT-29 (left) and GI-101A (right) xenografts were excised at day 42 and treated identical to their infected counterparts. Tissue sections were stained for MHCII and vital DNA (Hoechst). As expected, no Virus-derived GFP signal could be detected.
Figure 6
Figure 6
Mouse immune genes associated with the Immunologic Constant of Rejection Hypothesis. IPA self-organizing network based on genes with immune annotations whose expression was significantly up-regulated in VACV-infected GI-101A xenografts at day (A) 21 and (B) 42 from VACV-infection. (C) Self-organizing heat map based on genes associated with the ICR hypothesis. The genes were arbitrarily selected a priori based on previous studies as summarized in [2] and are displayed based on their expression in the current study without further selection.

References

    1. Wang E, Marincola FM. Bottom up: a modular view of immunology. Immunity. 2008;29:9–11. doi: 10.1016/j.immuni.2008.07.002. - DOI - PMC - PubMed
    1. Wang E, Worschech A, Marincola FM. The immunologic constant of rejection. Trends Immunol. 2008;29:256–262. doi: 10.1016/j.it.2008.03.002. - DOI - PubMed
    1. Hicks AM, Riedlinger G, Willingham MC, Alexander-Miller MA, von Kap-Herr C, Pettenati MJ, et al. Transferable anticancer innate immunity in spontaneous regression/complete resistance mice. Proc Natl Acad Sci USA. 2006;103:7753–7758. doi: 10.1073/pnas.0602382103. - DOI - PMC - PubMed
    1. Heise CC, Williams AM, Xue S, Propst M, Kirn DH. Intravenous administration of ONYX-015, a selectively replicating adenovirus, induces antitumoral efficacy. Cancer Res. 1999;59:2623–2628. - PubMed
    1. Gnant MF, Puhlmann M, Alexander HR, Jr, Bartlett DL. Systemic administration of a recombinant vaccinia virus expressing the cytosine deaminase gene and subsequent treatment with 5-fluorocytosine leads to tumor-specific gene expression and prolongation of survival in mice. Cancer Res. 1999;59:3396–3403. - PubMed

Publication types

LinkOut - more resources