. 2009 Jul 7:2:124.
doi: 10.1186/1756-0500-2-124.

BiGGEsTS: integrated environment for biclustering analysis of time series gene expression data

Affiliations

BiGGEsTS: integrated environment for biclustering analysis of time series gene expression data

Joana P Gonçalves et al. BMC Res Notes. .

Abstract

Background: The ability to monitor changes in expression patterns over time, and to observe the emergence of coherent temporal responses using expression time series, is critical to advance our understanding of complex biological processes. Biclustering has been recognized as an effective method for discovering local temporal expression patterns and unraveling potential regulatory mechanisms. The general biclustering problem is NP-hard. In the case of time series this problem is tractable, and efficient algorithms can be used. However, there is still a need for specialized applications able to take advantage of the temporal properties inherent to expression time series, both from a computational and a biological perspective.

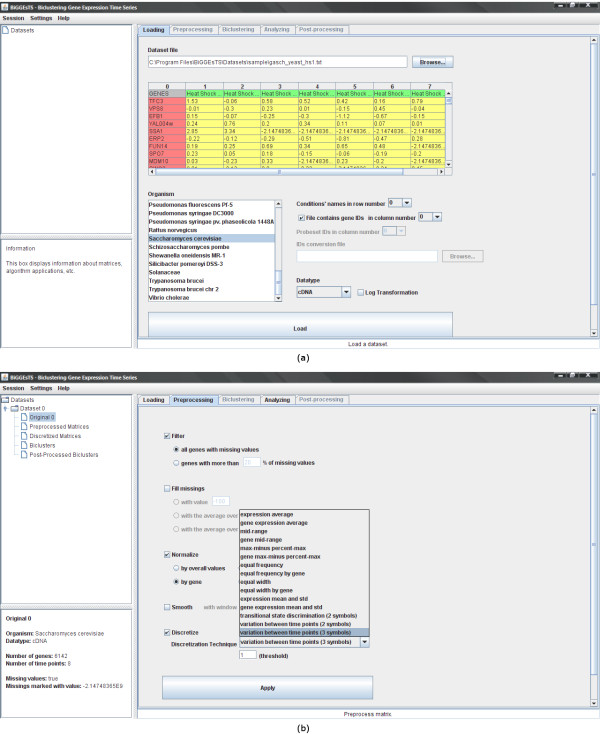
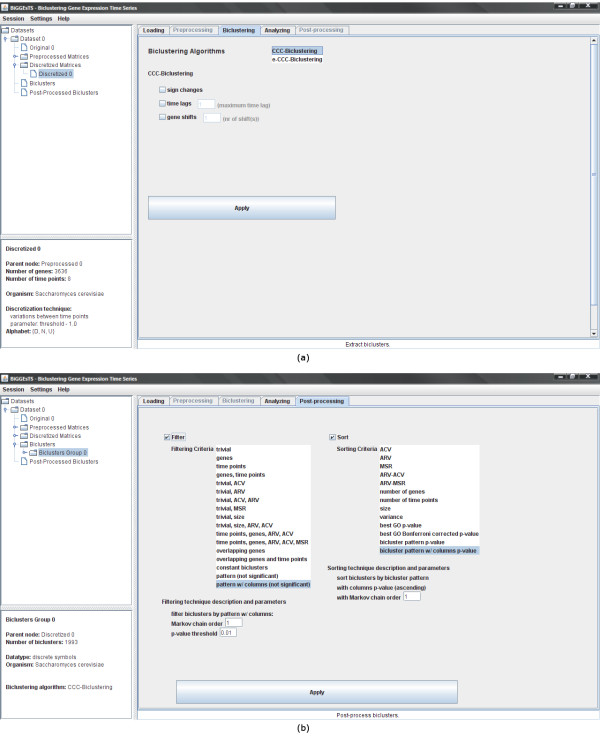
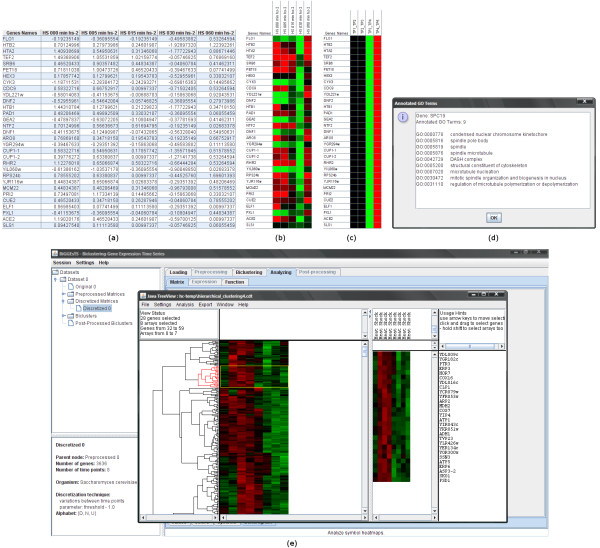
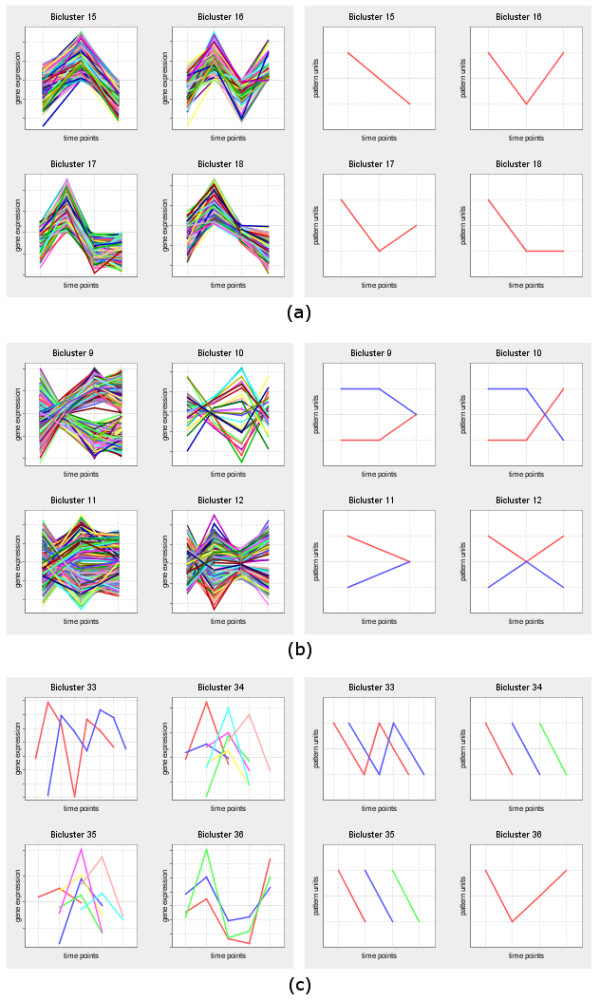
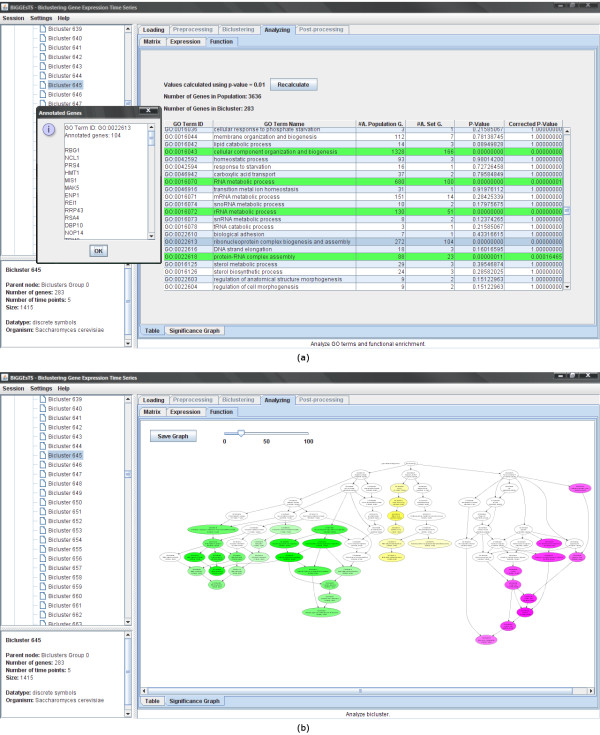
Findings: BiGGEsTS makes available state-of-the-art biclustering algorithms for analyzing expression time series. Gene Ontology (GO) annotations are used to assess the biological relevance of the biclusters. Methods for preprocessing expression time series and post-processing results are also included. The analysis is additionally supported by a visualization module capable of displaying informative representations of the data, including heatmaps, dendrograms, expression charts and graphs of enriched GO terms.

Conclusion: BiGGEsTS is a free open source graphical software tool for revealing local coexpression of genes in specific intervals of time, while integrating meaningful information on gene annotations. It is freely available at: http://kdbio.inesc-id.pt/software/biggests. We present a case study on the discovery of transcriptional regulatory modules in the response of Saccharomyces cerevisiae to heat stress.


Figures

Figure 1
Figure 1
Input and preprocessing modules. This figure shows: (a) The main window of BiGGEsTS and its input module for loading time series gene expression data. The graphical user interface (GUI) includes a set of tabs, for functionality selection, and three panels: a top-left panel displaying the dataset tree, where expression matrices and biclusters are organized; a bottom-left panel displaying a box with information about the selected node in the dataset tree; and a right panel, whose content depends on both the selected node and functionality tab. The navigation on the dataset tree, as well as on the tabs, is intuitive and straightforward. A session can be saved anytime to keep record of data and results. Saved sessions can be loaded later enabling researchers to recover previous stages of their analysis. The input of expression time series is performed using a standard text file. The file contains the elements of the gene expression matrix delimited by a specific character (usually tab), together with additional information about the data, including the organism, and the row and column specifying the names of the time points and the genes, respectively. When the names of the genes used in the biological experiments and their corresponding symbol approved by the Human Genome Organization (HUGO) Gene Nomenclature Committee (HGNC) differ, the researcher may want to provide an additional file. This input file is optional, since it is only required for retrieving the gene annotations and assessing the biological relevance of the biclusters. (b) The preprocessing module for filtering genes, filling missing values, normalizing, smoothing and/or discretizing gene expression data. Available preprocessing techniques are described in the Quickstart Guide [see Additional file 2].
Figure 2
Figure 2
Biclustering and post-processing modules. This figure shows: (a) biclustering and (b) post-processing modules. The biclustering module is used to select the biclustering algorithm to be applied to the expression matrix. Additional extensions enabling shifted, anti-correlated and time-lagged patterns are available in CCC-Biclustering and e-CCC-Biclustering. Different types of errors are supported in e-CCC-Biclustering. The post-processing module enables the researcher to select and apply filtering and sorting techniques to groups of biclusters. Biclusters can be filtered by setting a threshold for the number of genes and/or conditions, size, average column variance, average row variance, mean-squared residue score, and overlapping percentage of genes and/or conditions. It is also possible to remove biclusters with constant or statistically non significant patterns. Biclusters may additionally be sorted using their best functional enrichment p-value, statistical significance of expression pattern, average column or row variance, mean-squared residue score and a number of other measures available for selection. Details on biclustering and post-processing techniques are described in the Quickstart Guide [see Additional file 2].
Figure 3
Figure 3
Expression matrix, heatmaps, GO annotations, and dendrograms. This figure shows: (a) tables of values, (b) tables of colors, (c) tables of symbols, (d) list of GO terms annotating a gene, and (e) dendrograms. In the tables of values, the names of the experimental conditions appear in the first row and usually correspond to consecutive instants in time. The first column displays the names of the genes. Each remaining cell in the table contains the expression value of a given gene in a specific condition. In the tables of colors, cells with high expression values are, by default, colored red, while the ones with low expression values are given a green color. Cells holding the mean value are colored black. The intensity of the color is set according to the actual expression value of each cell, thus generating a scale of reds and greens for all possible expression values. Cells with no expression value, that is, a missing value, are given a yellow color. Tables of symbols resemble tables of colors and are computed using a discretized version of the expression matrix. The GO terms listed as annotations of a given gene correspond to the most specific GO terms (before applying the true path rule). Dendrograms are visualized using Java TreeView [25] in a separate window. They are displayed together with the expression matrix and enable the researcher to individually select clusters, which are then displayed in a separate panel. The researcher may further change the settings of the dendrogram, search for genes or conditions within the data, compare with other hierarchical clustering results and export both the dendrogram and the gene expression matrix as vector (PS) or raster (PNG, PPM, JPG) image files.
Figure 4
Figure 4
Expression and pattern charts. This figure shows examples of expression and pattern charts of (a) CCC-Biclusters, (b) CCC-Biclusters with anti-correlated patterns, and (c) CCC-Biclusters with time-lagged patterns. In expression charts, expression values can be normalized on the fly by checking the "Normalize to mean 0 and std 1" checkbox.
Figure 5
Figure 5
Term-for-term analysis and graph of enriched GO terms. This figure shows: (a) A summary of the results of the term-for-term analysis applied to a given bicluster. The list of genes annotated with GO term highlighted in blue is displayed at left. The GO terms highlighted in green correspond to highly significant terms. (b) A graph displaying the distribution of the biological terms in the ontology of GO terms. Enriched terms are colored in purple, yellow or green whether they specialize from cellular component, molecular function or biological process, respectively. The intensity of the color depends on the Bonferroni corrected p-value of the corresponding term: the lower the p-value, the more intense the color of its node. Arrows define specialization relations: each arrow goes from a more general term to its specialization(s).

References

    1. Madeira SC, Oliveira AL. Biclustering algorithms for biological data analysis: a survey. IEEE/ACM Trans Comput Biol Bioinform. 2004;1:24–45. doi: 10.1109/TCBB.2004.2. - DOI - PubMed
    1. Cheng Y, Church GM. Biclustering of expression data. Proc Int Conf Intell Syst Mol Biol. 2000;8:93–103. - PubMed
    1. Ben-Dor A, Chor B, Karp R, Yakhini Z. Discovering local structure in gene expression data: The Order-Preserving Submatrix Problem. J Comput Biol. 2003;10:373–384. doi: 10.1145/565196.565203. - DOI - PubMed
    1. Ji L, Tan K. Identifying time-lagged gene clusters using gene expression data. Bioinformatics. 2005;21:509–516. - PubMed
    1. Zhang Y, Zha H, Chu CH. Proc of the 5th IEEE International Conference on Information Technology: Coding and Computing. Las Vegas, Nevada, USA: IEEE Computer Society; 2005. A time-series biclustering algorithm for revealing co-regulated genes; pp. 32–37.

LinkOut - more resources