. 2009 Sep 11;284(37):24705-14.
doi: 10.1074/jbc.M109.000463. Epub 2009 Jul 6.

Nuclear factor-kappaB regulates estrogen receptor-alpha transcription in the human heart

Affiliations

Nuclear factor-kappaB regulates estrogen receptor-alpha transcription in the human heart

Shokoufeh Mahmoodzadeh et al. J Biol Chem. .

Abstract

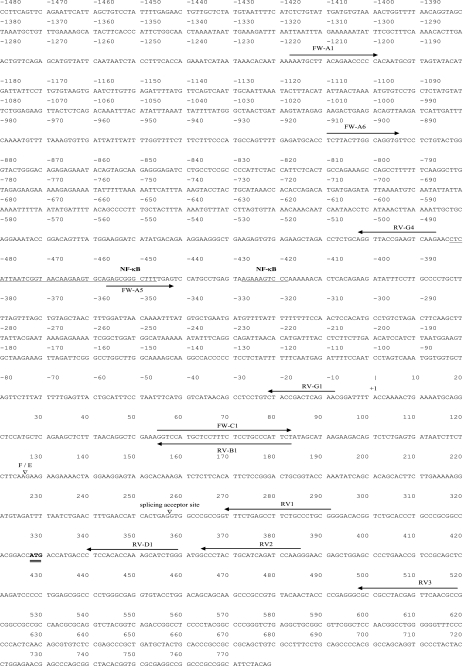
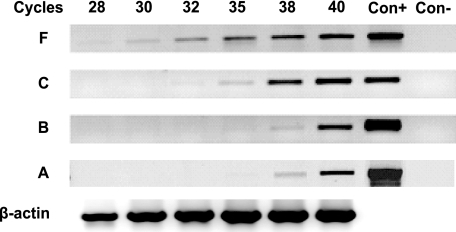
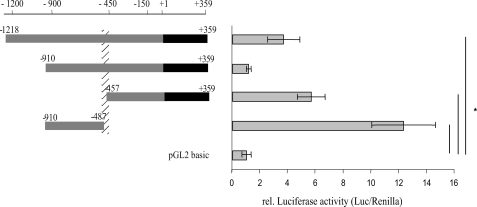
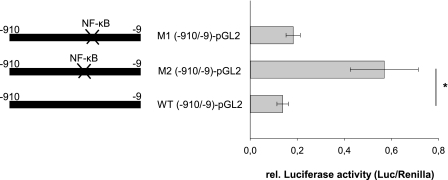
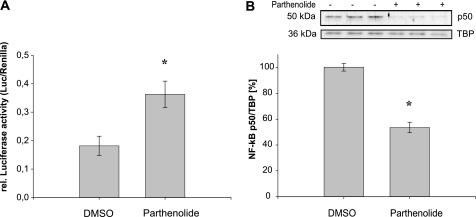
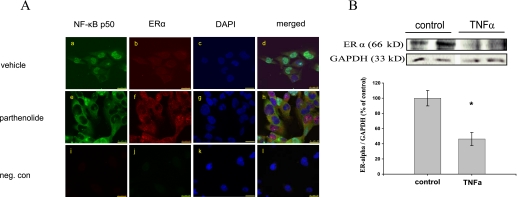
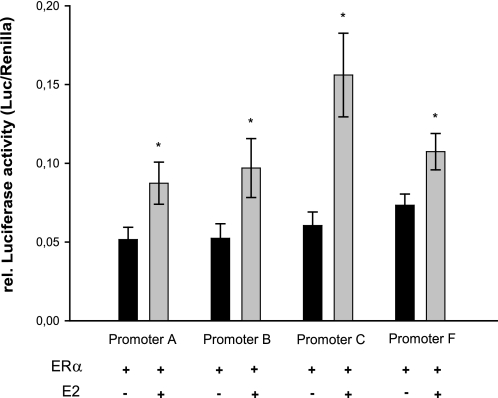
Estrogen receptor (ER)-mediated effects have been associated with the modulation of myocardial hypertrophy in animal models and in humans, but the regulation of ER expression in the human heart has not yet been analyzed. In various cell lines and tissues, multiple human estrogen receptor alpha (hERalpha) mRNA isoforms are transcribed from distinct promoters and differ in their 5'-untranslated regions. Using PCR-based strategies, we show that in the human heart the ERalpha mRNA is transcribed from multiple promoters, namely, A, B, C, and F, of which the F-promoter is most frequently used variant. Transient transfection reporter assays in a human cardiac myocyte cell line (AC16) with F-promoter deletion constructs demonstrated a negative regulatory region within this promoter. Site-directed mutagenesis and electrophoretic mobility shift assays indicated that NF-kappaB binds to this region. An inhibition of NF-kappaB activity by parthenolide significantly increased the transcriptional activity of the F-promoter. Increasing NF-kappaB expression by tumor necrosis factor-alpha reduced the expression of ERalpha, indicating that the NF-kappaB pathway inhibits expression of ERalpha in human cardiomyocytes. Finally, 17beta-estradiol induced the transcriptional activity of hERalpha promoters A, B, C, and F. In conclusion, inflammatory stimuli suppress hERalpha expression via activation and subsequent binding of NF-kappaB to the ERalpha F-promoter, and 17beta-estradiol/hERalpha may antagonize the inhibitory effect of NF-kappaB. This suggests interplay between estrogen/estrogen receptors and the pro-hypertrophic and inflammatory responses to NF-kappaB.


Figures

FIGURE 1.
FIGURE 1.
Partial DNA sequence of the human ERα F-promoter with its 5′-UTR and the first coding exon. 5′-UTR variant F is directly spliced to the 5′-UTR variant E2. The splicing site of F and E exons (F/E) are indicated by an open triangle. The transcriptional start site is set as +1, and translation start site (ATG) is double-underlined. The location and name of the primers used for construction of luciferase reporter assays are shown by arrows. The region containing putative transcription factor binding site is underlined.
FIGURE 2.
FIGURE 2.
Expression levels of multiple ERα transcripts. The appearance of the PCR products was monitored at progressive cycles during the amplification (28, 30, 32, 35, 38, and 40 cycles). A PCR F-fragment appeared for F-fragment after 28 cycles of amplification (320 bp, marked with a F), for C-fragment after 32 cycles (162 bp, marked with a C), for B-fragment after 35 cycles (218 bp, marked with a B), and for A-fragment after 35 cycles (591 bp, marked with an A). Con+, cDNA from MCF-7 cells was used as the positive control (35 cycles for each ERα transcript); Con-, negative PCR control (without DNA). The β-actin gene (481 bp) was used as a reference gene.
FIGURE 3.
FIGURE 3.
Functional analysis of hERα F-promoter deletion constructs in AC16 cells. The length of the promoter fragments are displayed by numbers (bp) referring to the transcription start of F-transcript, +1 bp. One μg of the promoter reporter construct and 10 ng of the Renilla luciferase reporter construct, as internal control, were co-transfected into AC16 cells using FuGENE® 6 reagent. Values represent firefly luciferase activities normalized to Renilla luciferase activities. The region between −486 and −458 bp contains a negative cis-acting element(s) critical for the basal F-promoter activity (marked with a hatched column). *, p ≤ 0.008 relative luciferase activities of promoter constructs versus the activity of pGL2-basic. All experiments were done in triplicate. Results are expressed as the means of separate transfection experiments (n = 5). The error bars represent ± S.E.
FIGURE 4.
FIGURE 4.
Transcriptional activity of the F-promoter after site-directed mutagenesis of putative binding sites for NF-κB. Shown are AC16 cells were co-transfected with 1 μg of either wild type reporter construct (−910/−9-pGL2) or reporter constructs containing mutations within the NF-κB binding site (M2 (−910/−9-pGL2)-pGL2) or the second NF-κB binding site (M1 (−910/−9-pGL2)-pGL2) downstream of the identified inhibitory region and 10 ng of Renilla luciferase reporter construct. All experiments were done in triplicate, and luciferase activities were measured 24 h after transfection. Mutations within the NF-κB binding site (M2 (−910/−9-pGL2)-pGL2) resulted in significant changes in luciferase activity, whereas mutations within NF-κB binding site (M1 (−910/−9-pGL2)-pGL2) showed no changes. Results are expressed as the means of separate transfection experiments (n = 6). The S.E. is indicated by the error bars. *, p ≤ 0.004 for the mutation constructs, and the relative luciferase activities of mutated constructs are shown relative to the activity of the wild type construct.
FIGURE 5.
FIGURE 5.
NF-κB binds to the −483 to −448-bp sequence within the hERα F-promoter. Electrophoretic mobility shift and supershift assays with the nuclear extracts from AC16 cells were performed as described under “Experimental Procedures.” The DNA-protein complex was analyzed by gel electrophoresis and visualized by autoradiography (lane 2). For competition assay, the nuclear extract was preincubated with a 100-fold molar excess of unlabeled oligonucleotide before the addition of the probe (lane 3). For the supershift assay, the nuclear extract was preincubated with a different amount of antibody, anti-NF-κB p50 (2, 4, and 6 μg) on ice for 30 min before the addition of the probe (lanes 4–6). Lane 1 contains only the labeled oligonucleotide. S and SS mark shifted bands and supershifted band, respectively.
FIGURE 6.
FIGURE 6.
A, inhibition of NF-κB resulted in an enhanced luciferase F-promoter reporter activity in AC16 cells. The −910/−9-pGL2 reporter construct was cotransfected with Renilla luciferase reporter construct into AC16 cells. Twenty-four hours after transfection, the cells were either treated with parthenolide (10 μmol/liter) or left untreated. Six hours after treatment the cell extracts were assayed for luciferase activity normalized to Renilla luciferase activity. B, parthenolide inhibits the translocation of NF-κB into nucleus. Representative Western blot performed with nuclear extracts of AC16 cells. Cells at 60–80% confluence were treated with vehicle (DMSO) or parthenolide (10 μmol/liter). After 6 h of treatment, cells were harvested, and nuclear proteins (5 μg) were isolated and subjected to Western blot analysis. Blots were incubated with anti-NF-κB p50 antibody. Nuclear specific protein TFIID (TBP) was used for normalization as described under “Experimental Procedures.” Results are expressed as the means of at least three separate experiments performed in triplicate. The error bars represent ±S.E. *, p < 0.05.
FIGURE 7.
FIGURE 7.
A, representative confocal images demonstrating the effect of NF-κB inhibition on the expression/accumulation of ERα. AC16 cells were treated with vehicle or parthenolide for 6 h and then fixed. NF-κB and ERα localizations were assessed by Immunofluorescence. The green fluorescence (fluorescein isothiocyanate) shows the location of NF-κB p50 and the red fluorescence (Cy-3), the location of ERα in AC16 cells. The nuclei were stained by 4′,6-diamidino-2-phenylindole (DAPI, blue). a and b, in most AC16 cells treated with vehicle, NF-κB was localized strongly in the nuclei, whereas ERα signal was detected at a low level in cytoplasm and nuclei. e and f, by contrast, in most AC16 cells treated with parthenolide, the staining pattern of NF-κB was predominantly cytoplasmic, with very low NF-κB p50 immunoreactivity in nuclei. In these cells, however, cytoplasm and a lot of nuclei showed very strong immunoreactivity for ERα in comparison to the untreated cells. c, g, and k, nuclei counterstaining using 4′,6-diamidino-2-phenylindole. d, h, and l, merged images from a–c, e–g, and i–k, respectively. i–l show the negative control where the primary antibodies against NF-κB and ERα were omitted; 63× magnification; calibration bar, 25 μm. B, TNFα treatment significantly reduced the protein expression level of hERα in AC16 cells (p ≤ 0.01). A representative Western blot demonstrating protein expression of ERα in AC16 cells treated or non-treated with TNFα for 5 h is shown. Cells were harvested, and whole cell extracts (50 μg) were isolated and subjected to Western blot analysis. Blots were incubated with anti-ERα antibody. Membranes were subsequently re-probed with a glyceraldehyde-3-phosphate dehydrogenase (GAPDH)-specific antibody as the internal standard. Data are calculated as the percent of non-treated cells (controls set as 100%) and are expressed as the mean ± S.E. of three independent experiments (n = 3) carried out in duplicate.
FIGURE 8.
FIGURE 8.
E2 increases the transcriptional activity of different hERα promoter variants via ERα. Various luciferase reporter constructs (A-promoter-pGL2, B-promoter-pGL2, C-promoter-pGL2, F-promoter-pGL2 (−1218/+358-pGL2)) were co-transfected with HEGO-vector along with Renilla luciferase reporter construct into AC16 cells, and the cells were then treated with estrogen (E2, 10−8 mol/liter) or left untreated. After 48 h, the luciferase activity was measured and normalized to the Renilla luciferase activity in each experiment. The graph shows the relative changes in reporter activity in response to E2. Results are expressed as the mean of more than three independent experiments performed in triplicate. The error bars represent ±S.E. *, p < 0.05 versus without stimulation.

Similar articles

Cited by

References

    1. Mendelsohn M. E., Karas R. H. (2005) Science 308, 1583–1587 - PubMed
    1. Mangelsdorf D. J., Thummel C., Beato M., Herrlich P., Schütz G., Umesono K., Blumberg B., Kastner P., Mark M., Chambon P., Evans R. M. (1995) Cell 83, 835–839 - PMC - PubMed
    1. Karas R. H., Patterson B. L., Mendelsohn M. E. (1994) Circulation 89, 1943–1950 - PubMed
    1. Venkov C. D., Rankin A. B., Vaughan D. E. (1996) Circulation 94, 727–733 - PubMed
    1. Nordmeyer J., Eder S., Mahmoodzadeh S., Martus P., Fielitz J., Bass J., Bethke N., Zurbrügg H. R., Pregla R., Hetzer R., Regitz-Zagrosek V. (2004) Circulation 110, 3270–3275 - PubMed

Publication types