Computational identification of a p38SAPK-regulated transcription factor network required for tumor cell quiescence
- PMID: 19584293
- PMCID: PMC2720524
- DOI: 10.1158/0008-5472.CAN-08-3820
Computational identification of a p38SAPK-regulated transcription factor network required for tumor cell quiescence
Abstract
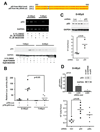
The stress-activated kinase p38 plays key roles in tumor suppression and induction of tumor cell dormancy. However, the mechanisms behind these functions remain poorly understood. Using computational tools, we identified a transcription factor (TF) network regulated by p38alpha/beta and required for human squamous carcinoma cell quiescence in vivo. We found that p38 transcriptionally regulates a core network of 46 genes that includes 16 TFs. Activation of p38 induced the expression of the TFs p53 and BHLHB3, while inhibiting c-Jun and FoxM1 expression. Furthermore, induction of p53 by p38 was dependent on c-Jun down-regulation. Accordingly, RNAi down-regulation of BHLHB3 or p53 interrupted tumor cell quiescence, while down-regulation of c-Jun or FoxM1 or overexpression of BHLHB3 in malignant cells mimicked the onset of quiescence. Our results identify components of the regulatory mechanisms driving p38-induced cancer cell quiescence. These may regulate dormancy of residual disease that usually precedes the onset of metastasis in many cancers.
Figures


Similar articles
-
Phenotype-assisted transcriptome analysis identifies FOXM1 downstream from Ras-MKK3-p38 to regulate in vitro cellular invasion.Oncogene. 2010 Mar 11;29(10):1519-30. doi: 10.1038/onc.2009.436. Epub 2009 Dec 21. Oncogene. 2010. PMID: 20023695
-
The p38 MAPK-MK2 axis regulates E2F1 and FOXM1 expression after epirubicin treatment.Mol Cancer Res. 2012 Sep;10(9):1189-202. doi: 10.1158/1541-7786.MCR-11-0559. Epub 2012 Jul 16. Mol Cancer Res. 2012. PMID: 22802261 Free PMC article.
-
PTPROt-mediated regulation of p53/Foxm1 suppresses leukemic phenotype in a CLL mouse model.Leukemia. 2015 Jun;29(6):1350-9. doi: 10.1038/leu.2014.341. Epub 2014 Dec 8. Leukemia. 2015. PMID: 25482129 Free PMC article.
-
Activation of c-Jun N-terminal kinase (JNK) by widely used specific p38 MAPK inhibitors SB202190 and SB203580: a MLK-3-MKK7-dependent mechanism.Cell Signal. 2008 Apr;20(4):675-83. doi: 10.1016/j.cellsig.2007.12.003. Epub 2007 Dec 8. Cell Signal. 2008. PMID: 18222647 Free PMC article.
-
Tumor cell dormancy induced by p38SAPK and ER-stress signaling: an adaptive advantage for metastatic cells?Cancer Biol Ther. 2006 Jul;5(7):729-35. doi: 10.4161/cbt.5.7.2968. Epub 2006 Jul 1. Cancer Biol Ther. 2006. PMID: 16861922 Free PMC article. Review.
Cited by
-
Regulation of Metastatic Tumor Dormancy and Emerging Opportunities for Therapeutic Intervention.Int J Mol Sci. 2022 Nov 11;23(22):13931. doi: 10.3390/ijms232213931. Int J Mol Sci. 2022. PMID: 36430404 Free PMC article. Review.
-
Mirk/dyrk1B Kinase in Ovarian Cancer.Int J Mol Sci. 2013 Mar 8;14(3):5560-75. doi: 10.3390/ijms14035560. Int J Mol Sci. 2013. PMID: 23528858 Free PMC article.
-
Epigenetic plasticity in metastatic dormancy: mechanisms and therapeutic implications.Ann Transl Med. 2020 Jul;8(14):903. doi: 10.21037/atm.2020.02.177. Ann Transl Med. 2020. PMID: 32793747 Free PMC article. Review.
-
The Influence of Ligand Density and Degradability on Hydrogel Induced Breast Cancer Dormancy and Reactivation.Adv Healthc Mater. 2021 Jun;10(11):e2002227. doi: 10.1002/adhm.202002227. Epub 2021 Apr 30. Adv Healthc Mater. 2021. PMID: 33929776 Free PMC article.
-
NR2F1 contributes to cancer cell dormancy, invasion and metastasis of salivary adenoid cystic carcinoma by activating CXCL12/CXCR4 pathway.BMC Cancer. 2019 Jul 29;19(1):743. doi: 10.1186/s12885-019-5925-5. BMC Cancer. 2019. PMID: 31357956 Free PMC article.
References
-
- Bulavin DV, Fornace AJ., Jr p38 MAP kinase's emerging role as a tumor suppressor. Adv Cancer Res. 2004;92:95–118. - PubMed
-
- Bulavin DV, Demidov ON, Saito S, et al. Amplification of PPM1D in human tumors abrogates p53 tumor-suppressor activity. Nat Genet. 2002;31:210–215. - PubMed
-
- Bulavin DV, Phillips C, Nannenga B, et al. Inactivation of the Wip1 phosphatase inhibits mammary tumorigenesis through p38 MAPK-mediated activation of the p16(Ink4a)-p19(Arf) pathway. Nat Genet. 2004;36:343–350. - PubMed
-
- Ventura JJ, Tenbaum S, Perdiguero E, et al. p38alpha MAP kinase is essential in lung stem and progenitor cell proliferation and differentiation. Nat Genet. 2007;39:750–758. - PubMed
-
- Hui L, Bakiri L, Mairhorfer A, et al. p38alpha suppresses normal and cancer cell proliferation by antagonizing the JNK-c-Jun pathway. Nat Genet. 2007;39:741–749. - PubMed
Publication types
MeSH terms
Substances
Grants and funding
LinkOut - more resources
Full Text Sources
Research Materials
Miscellaneous

