. 2009 Oct;58(10):2344-54.
doi: 10.2337/db09-0167. Epub 2009 Jul 7.

Foxo1 links hyperglycemia to LDL oxidation and endothelial nitric oxide synthase dysfunction in vascular endothelial cells

Affiliations

Foxo1 links hyperglycemia to LDL oxidation and endothelial nitric oxide synthase dysfunction in vascular endothelial cells

Jun Tanaka et al. Diabetes. 2009 Oct.

Abstract

Objective: Atherosclerotic cardiovascular disease is the leading cause of death among people with diabetes. Generation of oxidized LDLs and reduced nitric oxide (NO) availability because of endothelial NO synthase (eNOS) dysfunction are critical events in atherosclerotic plaque formation. Biochemical mechanism leading from hyperglycemia to oxLDL formation and eNOS dysfunction is unknown.

Research design and methods: We show that glucose, acting through oxidative stress, activates the transcription factor Foxo1 in vascular endothelial cells.

Results: Foxo1 promotes inducible NOS (iNOS)-dependent NO-peroxynitrite generation, which leads in turn to LDL oxidation and eNOS dysfunction. We demonstrate that Foxo1 gain-of-function mimics the effects of hyperglycemia on this process, whereas conditional Foxo1 knockout in vascular endothelial cells prevents it.

Conclusions: The findings reveal a hitherto unsuspected role of the endothelial iNOS-NO-peroxynitrite pathway in lipid peroxidation and eNOS dysfunction and suggest that Foxo1 activation in response to hyperglycemia brings about proatherogenic changes in vascular endothelial cell function.


Figures
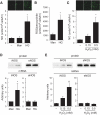
FIG. 1.
FIG. 1.
iNOS-dependent NO and ROS/peroxynitrite generation in response to high glucose or oxidative stress in HAECs and in mice. A–F: HAECs were incubated in medium containing 5.5 mmol/l glucose (–), 25 mmol/l glucose (HG) or 25 mmol/l mannitol (Man) for 48 h, or H2O2 (0.15 or 0.5 mmol/l) for 12 h with (E and F) or without (A–D) either iNOS (1400W) or eNOS inhibitors (l-NAME). A, C, and F: Representative images (upper panels) and calculated relative intensities (lower panels) of NO production using DAF2-DA. B: ROS/peroxynitrite production using carboxy-H2DCFDA. D and E: iNOS and eNOS protein (upper panel) and mRNA (lower panel) expression. G: Blood glucose, (H) aortic iNOS mRNA expression, (I) iNOS immunohistochemistry in aortic sections from C57BL/6J mice (first and second panel from the left) and from Tie2-cre/Foxo1flox/flox and Foxo1flox/flox mice (third and fourth panel from the left), and (J) plasma lipid peroxide levels (TBARS) in STZ-induced diabetic and saline-treated control mice (n = 6 for each group). The data were obtained two weeks after STZ injection. *P < 0.05; **P < 0.01 by Student's t test. (A high-quality digital representation of this figure is available in the online issue.)
FIG. 1.
FIG. 1.
iNOS-dependent NO and ROS/peroxynitrite generation in response to high glucose or oxidative stress in HAECs and in mice. A–F: HAECs were incubated in medium containing 5.5 mmol/l glucose (–), 25 mmol/l glucose (HG) or 25 mmol/l mannitol (Man) for 48 h, or H2O2 (0.15 or 0.5 mmol/l) for 12 h with (E and F) or without (A–D) either iNOS (1400W) or eNOS inhibitors (l-NAME). A, C, and F: Representative images (upper panels) and calculated relative intensities (lower panels) of NO production using DAF2-DA. B: ROS/peroxynitrite production using carboxy-H2DCFDA. D and E: iNOS and eNOS protein (upper panel) and mRNA (lower panel) expression. G: Blood glucose, (H) aortic iNOS mRNA expression, (I) iNOS immunohistochemistry in aortic sections from C57BL/6J mice (first and second panel from the left) and from Tie2-cre/Foxo1flox/flox and Foxo1flox/flox mice (third and fourth panel from the left), and (J) plasma lipid peroxide levels (TBARS) in STZ-induced diabetic and saline-treated control mice (n = 6 for each group). The data were obtained two weeks after STZ injection. *P < 0.05; **P < 0.01 by Student's t test. (A high-quality digital representation of this figure is available in the online issue.)
FIG. 2.
FIG. 2.
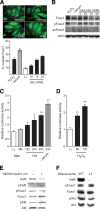
Foxo1 activation and insulin receptor phosphorylation in HAECs and aortas. A: Foxo1-GFP localization in HAECs cultured with 2% FBS (+serum), 25 mmol/l glucose (HG), 0.5 mmol/l H2O2, or serum withdrawal (−serum). Data are quantified in the lower panel, which includes a dose-response curve for glucose-induced Foxo1 translocation. B: Foxo1 phosphorylation and acetylation determined by Western blotting with antiphospho-Foxo1 (Ser253) and antiacetyl-Foxo1 antibodies in HAECs treated with different glucose concentrations or H2O2 for 24 h. C and D: Foxo1 reporter assays in HUVECs transfected with 3xIgfBP-RE/Luc plasmid and treated with 25 mmol/l glucose (HG), mannitol (Man), or H2O2 (0.5 mmol/l) for the indicated lengths of time. E and F: Western blotting analysis of InsR, Foxo1, and Akt expression, InsRY1158/Y1162/Y1163, Foxo1S253, and AktS473 phosphorylation in HAECs incubated with 100 nmol/l insulin for 16 h to induce InsR downregulation (E), or in aortas dissected from mice lacking InsR in all cell types of the arterial wall (L1) (18) (F). *P < 0.05; **P < 0.01 by Student's t test. (A high-quality digital representation of this figure is available in the online issue.)
FIG. 3.
FIG. 3.
Foxo1ADA increases iNOS mRNA, NO, and ROS/peroxynitrite generation. HAECs were transduced with increasing concentrations of HA-Foxo1ADA for 24 h (A–D and F) with or without pretreatment of the eNOS inhibitor, l-NAME, or iNOS inhibitor, 1400W (E and G). A: Endogenous and exogenous Foxo1 Western blotting using anti-Foxo1 and anti-HA antibodies. B and E: NO production using DAF-2DA. C: ROS/peroxynitrite production using carboxy-H2DCFDA. D: iNOS and eNOS proteins (upper panel) and mRNA (lower panel) expression levels. F and G: Total amount of NOx concentration in the medium. *P < 0.05; **P < 0.01.
FIG. 4.
FIG. 4.
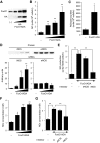
LDL oxidation and eNOS dimerization in response to Foxo1ADA. A: LDL oxidation (measured as TBARS) in HAECs expressing Foxo1ADA and incubated with native LDL. Sin-1, a NO and superoxide donor, was used as a positive control to generate peroxynitrite. B: LDL oxidation in HAECs expressing Foxo1ADA and treated with the iNOS inhibitor, 1400W. C: Low-temperature western blotting to detect eNOS dimers in HAECs transfected with Foxo1ADA or treated with different glucose concentrations for 48 h. D: Basal and insulin/calcium ionophore-stimulated NO production using DAF2-DA. E: ROS production and (F) NOx concentration in the medium of HAECs transduced with Foxo1ADA and treated with insulin/calcium ionophore. *P < 0.05; **P < 0.01 by Student's t test. (A high-quality digital representation of this figure is available in the online issue.)
FIG. 5.
FIG. 5.
Foxo1 binding to the iNOS promoter is required for NO production and LDL oxidation. A: Western blotting with anti-Foxo1, anti-HA, anti-FLAG, and antiactin antibodies in HAECs expressing HA-Foxo1ADA or FLAG-DBD-Foxo1ADA adenoviruses (14). B: NO production was estimated with DAF-2DA. C: LDL oxidation in HAECs cultured in the presence of native LDL. D: iNOS promoter reporter assays in transiently transfected HUVECs after transduction with HA-Foxo1ADA or FLAG-DBD-Foxo1ADA adenoviruses. E: ChIP assays of intact chromatin isolated from HAECs transduced with control (“C”) or HA-Foxo1ADA (“F”) adenoviruses, using rabbit control IgG and anti-Foxo1 antibodies. Total input DNA is shown on the right. *P < 0.05; **P < 0.01.
FIG. 6.
FIG. 6.
siRNA-mediated Foxo1 knockdown prevents iNOS mRNA induction. A: Phase contrast image of transfected HAECs (upper left). siRNA transfection efficiency, determined using siGLO Red transfection indicator (red, upper right). Nuclei are visualized with Hoechst 33342 (blue, lower left). Merged images are shown in the lower right panel. B: Foxo isoform and (C) iNOS expression in HAECs transfected with Foxo1, Foxo3, and Foxo4 siRNA, singly or in combination. *P < 0.05; **P < 0.01 by Student's t test. (A high-quality digital representation of this figure is available in the online issue.)
FIG. 7.
FIG. 7.
Conditional ablation of Foxo1 in vascular endothelial cells (EC) impairs iNOS induction and lowers lipid peroxides levels in diabetic mice. A: PCR genotyping of whole tissue or affinity-purified liver and lung endothelial cells from Tie2-cre/Foxo1flox/flox and Foxo1flox/flox mice (17). B: Foxo1 and Foxo3 Western blot in endothelial cells isolated from Tie2-cre/Foxo1flox/flox and Foxo1flox/flox mice. C: Blood glucose, aortic iNOS mRNA, and serum lipid peroxides levels in Tie2-cre/Foxo1flox/flox and Foxo1flox/flox mice, examined 2 weeks after diabetes induction by STZ (n = 12 for each genotype). *P < 0.05 by Student's t test. VEFKO, vascular endothelial cell Foxo1 knockout.

References

    1. National Institute of Diabetes and Digestive and Kidney Diseases. National Diabetes Statistics Fact Sheet: General Information and National Estimates on Diabetes in the United States Bethesda, MD, U.S. Department of Health and Human Services, National Institute of Health, 2005
    1. U.K. Prospective Diabetes Study Group. Intensive blood-glucose control with sulphonylureas or insulin compared with conventional treatment and risk of complications in patients with type 2 diabetes (UKPDS 33). Lancet 1998; 352: 837– 853 - PubMed
    1. Hanley AJ, Williams K, Stern MP, Haffner SM: Homeostasis model assessment of insulin resistance in relation to the incidence of cardiovascular disease: the San Antonio Heart Study. Diabetes Care 2002; 25: 1177– 1184 - PubMed
    1. Yip J, Facchini FS, Reaven GM: Resistance to insulin-mediated glucose disposal as a predictor of cardiovascular disease. J Clin Endocrinol Metab 1998; 83: 2773– 2776 - PubMed
    1. Brownlee M: Biochemistry and molecular cell biology of diabetic complications. Nature 2001; 414: 813– 820 - PubMed

Publication types

MeSH terms