

doi: 10.1038/nm.1993.
Epub 2009 Jul 5.
Alefacept promotes co-stimulation blockade based allograft survival in nonhuman primates
Affiliations
- PMID: 19584865
- PMCID: PMC2772128
- DOI: 10.1038/nm.1993
Item in Clipboard
Alefacept promotes co-stimulation blockade based allograft survival in nonhuman primates
Nat Med.
2009 Jul.
Abstract
Memory T cells promote allograft rejection particularly in co-stimulation blockade-based immunosuppressive regimens. Here we show that the CD2-specific fusion protein alefacept (lymphocyte function-associated antigen-3-Ig; LFA -3-Ig) selectively eliminates memory T cells and, when combined with a co-stimulation blockade-based regimen using cytotoxic T lymphocyte antigen-4 (CTLA-4)-Ig, a CD80- and CD86-specific fusion protein, prevents renal allograft rejection and alloantibody formation in nonhuman primates. These results support the immediate translation of a regimen for the prevention of allograft rejection without the use of calcineurin inhibitors, steroids or pan-T cell depletion.
Figures
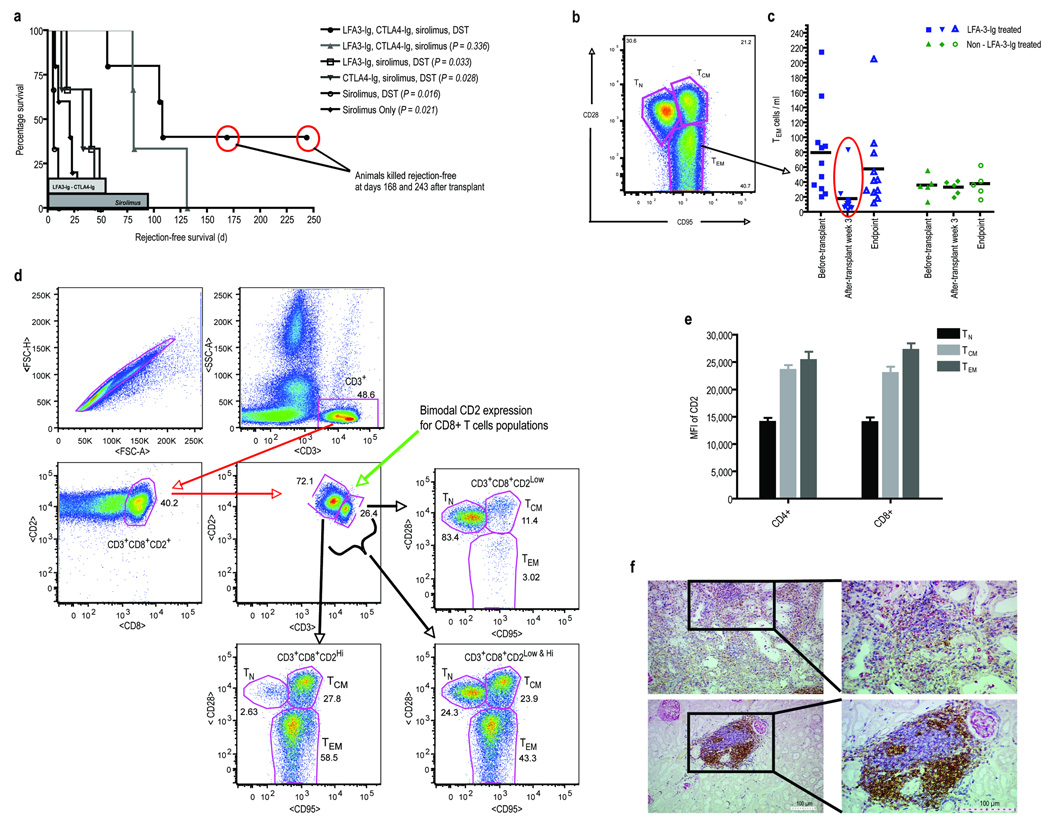
(a.) Rejection-free survival defined as the interval between the time of transplantation and the first allograft rejection event shown in days by treatment group. The duration of therapy is shown in the shaded bars along the x-axis. P values were determined by Student’s t-test (two-tailed) comparing each individual group versus the treatment group receiving LFA3-Ig, CTLA4-Ig, sirolimus, DST. This group had significantly prolonged rejection-free survival compared to all groups except the group receiving the combined therapy without DST. Similarly, the two groups receiving both LFA3-Ig and CTLA4-Ig, when considered together, had significantly prolonged survival compared to all other groups combined (p=0.002, two tailed Student’s t-test). The groups did not differ by sirolimus level or donor-directed mixed lymphocyte reactivity (See Supplementary Table 1 online). Two animals in the combined therapy group were killed with normal graft function after developing alloantibody. (b.) Polychromatic flow cytometry (PFC) was used to analyze LFA3-Ig’s depletional influence on PBMC T-cell subsets: naïve (TN; CD4+CD28+CD95low/−, β7 integrinint and CD8+CD28+CD95low/−, CD11alow), central memory (TCM; CD28+CD95+ or CD45RA−CD62L+ in both CD4+ and CD8+ cells), and effector memory (TEM; CD4+CD28−CD95+or CD45RAhigh and CD8+CD28−CD95+ or CD11ahigh). Shown is a representative gate defining the three subsets for T-cells previously gated for CD3. (c.) The influence of LFA3-Ig treatment of peripheral TEM-cell count levels is shown for all animals pre-transplant, 3 weeks post-transplant, and at terminal end points. Animals receiving LFA3-Ig are shown to the left in blue, and animals that did not receive LFA3-Ig are shown to the right in green. The mean values for each group are shown as black horizontal bars. TM-cells were significantly reduced after 3 weeks of LFA3-Ig therapy with the greatest depletion seen in the TEM (CD28−CD95+) subset of CD4+ and CD8+ T-cells (p=0.007, two-tailed Student’s t-test comparing pre and post transplant cell counts) without significant alteration in the absolute numbers of naive T-cells. This was not seen in non-LFA3-Ig treated animals. No significant difference in naïve T-cells was observed between LFA3-Ig and non-LFA3-Ig treated animals at each time point. At the time of rejection or sacrifice, TEM counts in LFA3-Ig treated animals had returned to normal. (d.) There is an inverse relationship between the surface expression of CD2 (the target of LFA3-Ig) and CD28 (the relevant receptor blocked with CTLA4-Ig). Shown are results from PFC experiments performed on freshly isolated peripheral blood lymphocytes obtained from untreated animals. T-cells prior to treatment have a bimodal expression of CD2 and CD3, with antigen experienced cells having lower CD3 expression and higher CD2 expression (center panel). Shown is this relationship for CD8+ T-cells based on PFC plots. The CD3hiCD2lo cells are predominently TN (upper right) while the CD3loCD2hi cells are predominently TEM (lower left). TCM cells are less distinctly segregated by these markers. (e.) Summary data from five untreated animals relating the mean fluorescnce intensity (MFI) of CD2 to the surface phenotype for both CD4+ and CD8+ T-cells. (f.) Renal allograft histological examination of necropsy specimens from a healthy, rejection-free animal with immunohistochemical (IHC) staining for T-cells (blue – CD3+), B-cells (brown – CD79+), and macrophages (pink/red – Ham-56) at low (left images) and higher (right images) magnification. Despite normal renal allograft function and no clinical signs/symptoms of rejection, multiple focal and highly organized cellular infiltrates where observed (lower panels). Interestingly, the cellular infiltrates were predominately aggregates of T- and B-cells, with minimal or no macrophages. In comparison, examination of rejecting animals using identical IHC staining demonstrated diffuse infiltrates without focal organization displaying greater cellular heterogeneity. Importantly, there were greater numbers of macrophages observed per objective field compared to the infiltrates seen in non-rejecting allografts, which has been shown to be of functional significance. Note the Ham-56 macrophage marker is also present on mesangial cells. As a result, glomeruli will also stain positive (pink) for Ham-56 as seen throughout the histological specimens.
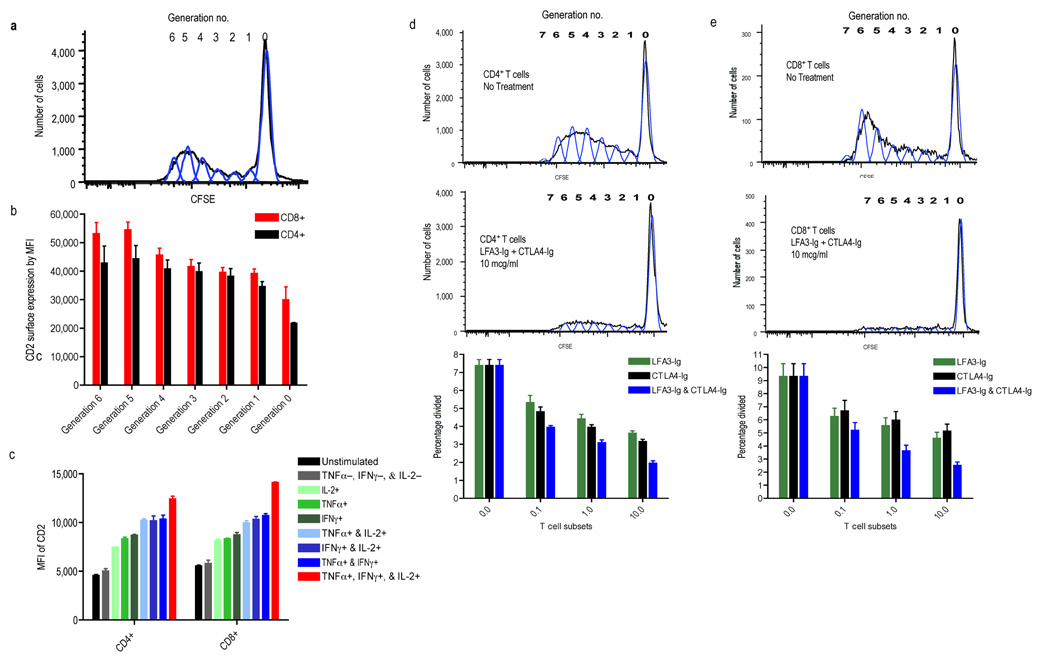
Shown are studies investigating the relationship between CD2 expression and alloresponsiveness in mixed lymphocyte culture (MLC) as measured by proliferation and cytokine production. (a.) CFSE-labeled T-cells responding in MLC progressively lose fluorescence intensity by a factor of two permitting alloresponsive cells to be distinguished from non-dividing cells and each generation of division (generation #) to be separately evaluated by PFC. (b.) PFC evaluation of each CFSE generation for accessory molecule expression (CD4 or CD8) and CD2, the target of LFA3-Ig demonstrates that each progressive cell division is associated with a concomitant increase in surface CD2 expression, suggesting that the most alloresponsive cells are the most susceptible to LFA3-Ig treatment. (c.) Intracellular cytokine staining relating CD2 expression and cytokine secretion (IFN-γ, TNF-α, and/or IL-2) produced following allostimulation shows that T-cells with the most developed cytokine production capabilities express the highest density of surface CD2, with poly-functional cells, those expressing IFN-γ, TNF-α, and IL-2 (red bars), having the greatest CD2 density. (d.) Proliferation of both CD4+ and (e.) CD8+ T-cells in CFSE MLC is inhibited with CTLA4-Ig and LFA3-Ig, and the combination of both agents is more effective than either agent alone across a 3-log concentration range. Results of MLCs are shown for untreated cells (top), and cells treated with both agents at 10ug/ml (middle) demonstrating that treatment markedly attenuated proliferations. The bottom panels display summary data expressed as percent cells divided during MLC across 4 different concentrations of CTLA4-Ig and/or LFA3-Ig, (0.0, 0.1, 1.0, and 10 ug/ml). A dose dependent decrease in proliferation is seen with the combination therapy having the lowest proliferative capacity at all concentrations tested.
Similar articles
-
Belatacept and sirolimus prolong nonhuman primate renal allograft survival without a requirement for memory T cell depletion.Am J Transplant. 2013 Feb;13(2):320-8. doi: 10.1111/j.1600-6143.2012.04342.x. Epub 2013 Jan 11. Am J Transplant. 2013. PMID: 23311611 Free PMC article.
-
Selective targeting of human alloresponsive CD8+ effector memory T cells based on CD2 expression.Am J Transplant. 2011 Jan;11(1):22-33. doi: 10.1111/j.1600-6143.2010.03317.x. Epub 2010 Nov 10. Am J Transplant. 2011. PMID: 21070604 Free PMC article.
-
Belatacept and sirolimus prolong nonhuman primate islet allograft survival: adverse consequences of concomitant alefacept therapy.Am J Transplant. 2013 Feb;13(2):312-9. doi: 10.1111/j.1600-6143.2012.04341.x. Epub 2012 Dec 27. Am J Transplant. 2013. PMID: 23279640 Free PMC article.
-
Novel immunosuppressive agents in kidney transplantation.Clin Nephrol. 2010 May;73(5):333-43. doi: 10.5414/cnp73333. Clin Nephrol. 2010. PMID: 20420793 Review.
-
Biological agents in kidney transplantation: belatacept is entering the field.Expert Opin Biol Ther. 2010 Oct;10(10):1501-8. doi: 10.1517/14712598.2010.514901. Expert Opin Biol Ther. 2010. PMID: 20726688 Review.
Cited by
-
mTOR Inhibitor Therapy Diminishes Circulating CD8+ CD28- Effector Memory T Cells and Improves Allograft Inflammation in Belatacept-refractory Renal Allograft Rejection.Transplantation. 2020 May;104(5):1058-1069. doi: 10.1097/TP.0000000000002917. Transplantation. 2020. PMID: 31415033 Free PMC article. Clinical Trial.
-
GVHD after haploidentical transplantation: a novel, MHC-defined rhesus macaque model identifies CD28- CD8+ T cells as a reservoir of breakthrough T-cell proliferation during costimulation blockade and sirolimus-based immunosuppression.Blood. 2010 Dec 9;116(24):5403-18. doi: 10.1182/blood-2010-06-289272. Epub 2010 Sep 10. Blood. 2010. PMID: 20833977 Free PMC article.
-
Recognizing Complexity of CD8 T Cells in Transplantation.Transplantation. 2024 Nov 1;108(11):2186-2196. doi: 10.1097/TP.0000000000005001. Epub 2024 Apr 19. Transplantation. 2024. PMID: 38637929 Review.
-
CD57(+) CD4 T Cells Underlie Belatacept-Resistant Allograft Rejection.Am J Transplant. 2016 Apr;16(4):1102-12. doi: 10.1111/ajt.13613. Epub 2016 Jan 14. Am J Transplant. 2016. PMID: 26603381 Free PMC article.
-
B Cell Depletion With an Anti-CD20 Antibody Enhances Alloreactive Memory T Cell Responses After Transplantation.Am J Transplant. 2016 Feb;16(2):672-8. doi: 10.1111/ajt.13483. Epub 2015 Nov 9. Am J Transplant. 2016. PMID: 26552037 Free PMC article.
References
Publication types
MeSH terms
Substances
Grants and funding
LinkOut - more resources
Full Text Sources
Other Literature Sources
Medical
