. 2009 Jul;15(7):757-65.
doi: 10.1038/nm.1979. Epub 2009 Jul 5.

TGF-beta1-induced migration of bone mesenchymal stem cells couples bone resorption with formation

Affiliations

TGF-beta1-induced migration of bone mesenchymal stem cells couples bone resorption with formation

Yi Tang et al. Nat Med. 2009 Jul.

Abstract

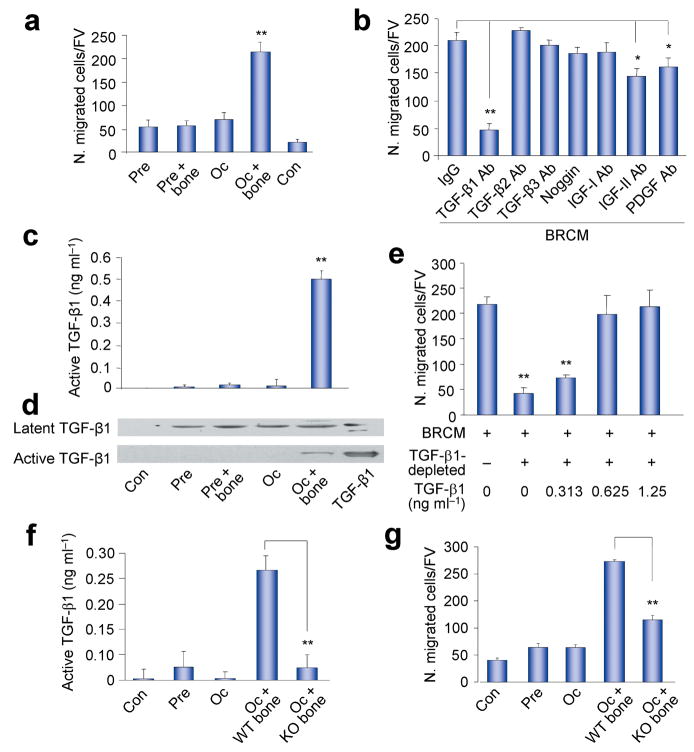
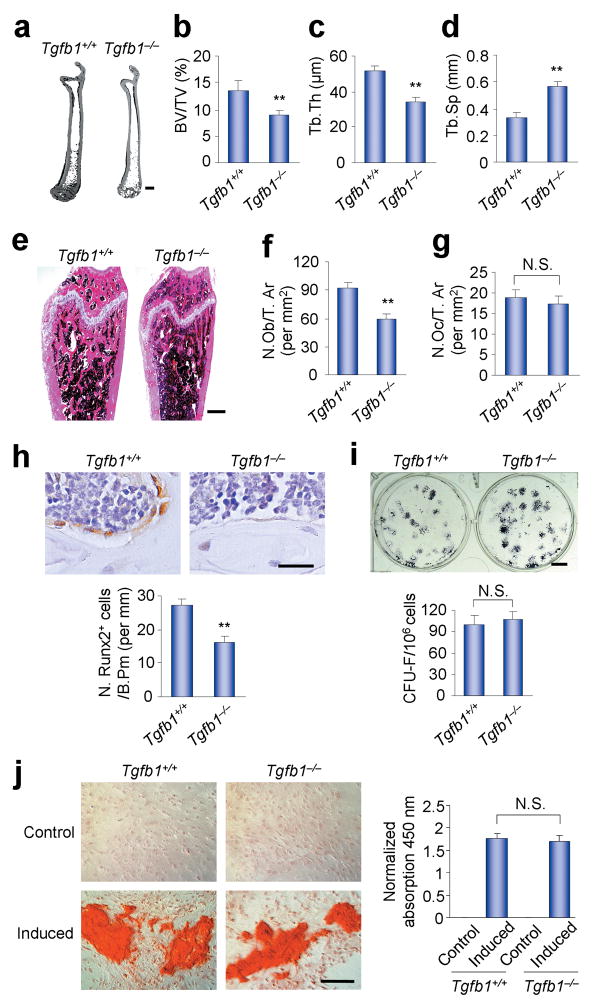
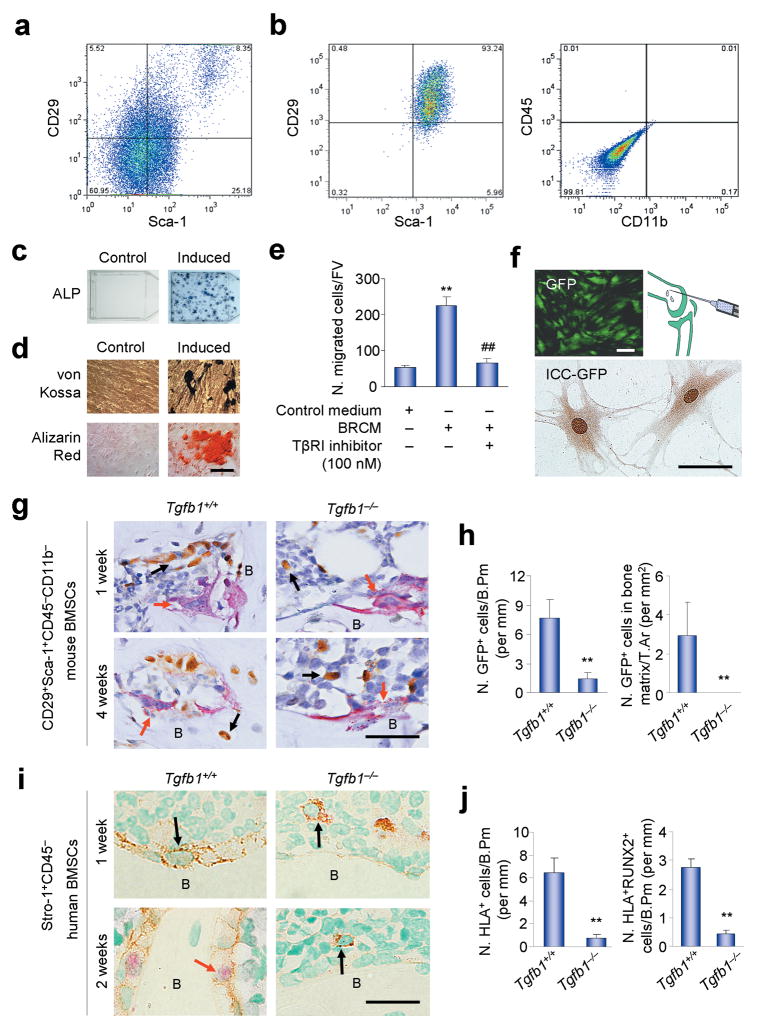
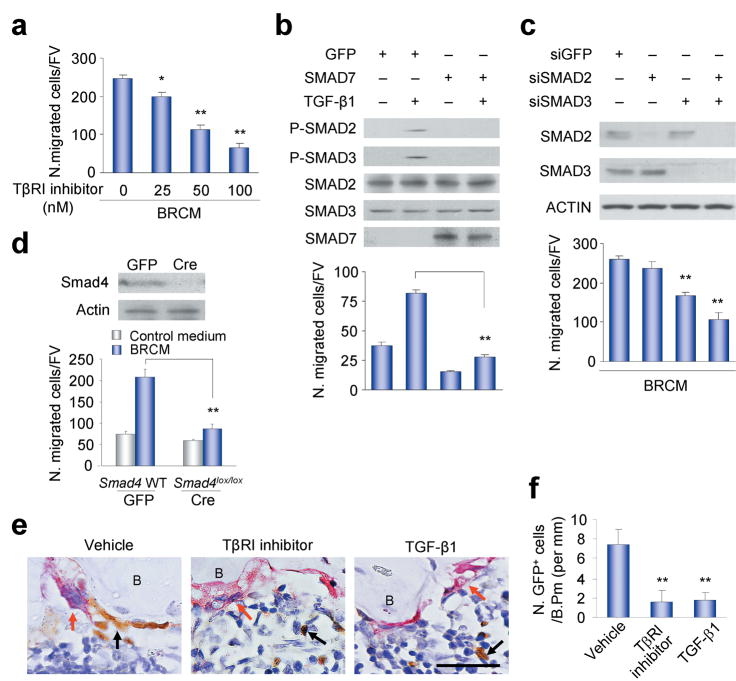
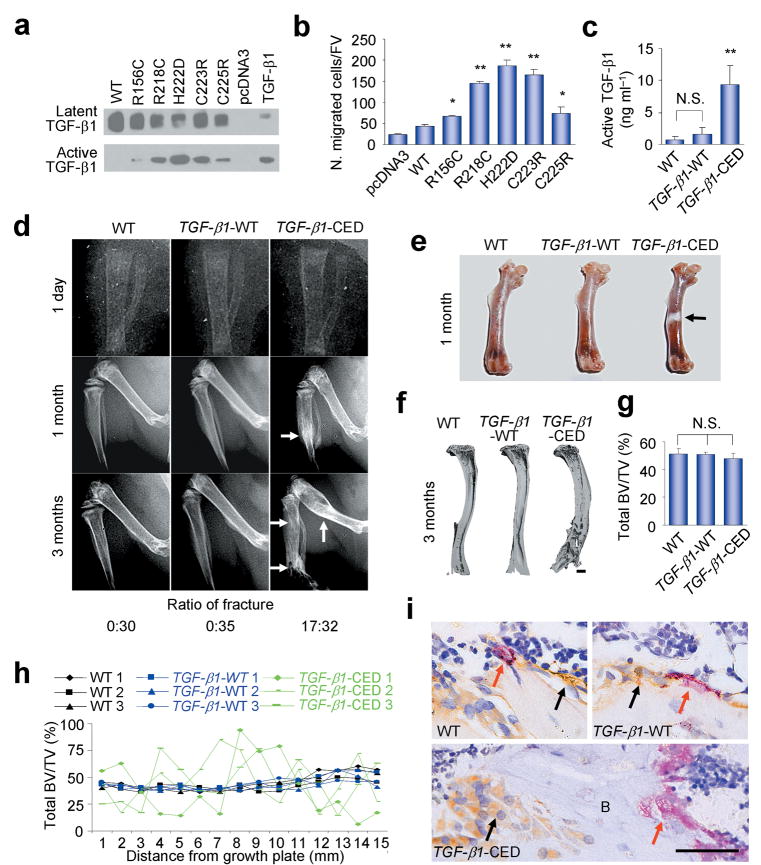
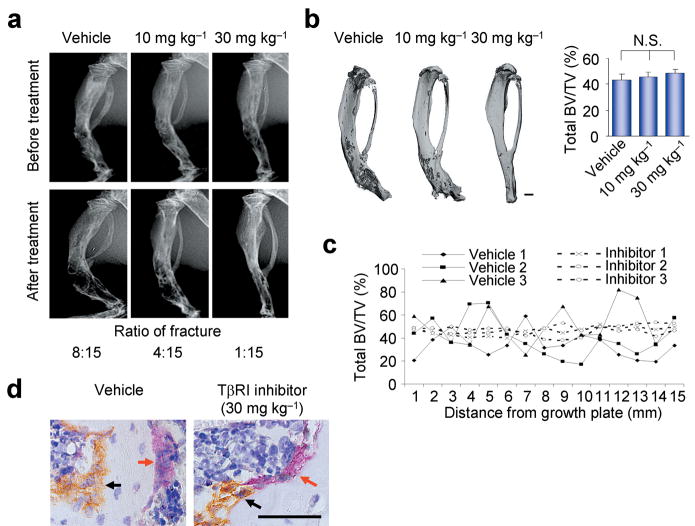
Bone remodeling depends on the precise coordination of bone resorption and subsequent bone formation. Disturbances of this process are associated with skeletal diseases, such as Camurati-Engelmann disease (CED). We show using in vitro and in vivo models that active TGF-beta1 released during bone resorption coordinates bone formation by inducing migration of bone marrow stromal cells, also known as bone mesenchymal stem cells, to the bone resorptive sites and that this process is mediated through a SMAD signaling pathway. Analyzing mice carrying a CED-derived mutant TGFB1 (encoding TGF-beta1), which show the typical progressive diaphyseal dysplasia seen in the human disease, we found high levels of active TGF-beta1 in the bone marrow. Treatment with a TGF-beta type I receptor inhibitor partially rescued the uncoupled bone remodeling and prevented the fractures. Thus, as TGF-beta1 functions to couple bone resorption and formation, modulation of TGF-beta1 activity could be an effective treatment for bone remodeling diseases.


Figures

Figure 1
Figure 1
Osteoclastic bone resorption-conditioned medium (BRCM) induces migration of BMSCs. (a) Transwell assays for migration of human STRO-1+ BMSCs using BRCM harvested from different cell cultures (Pre, osteoclast precursors culture; Pre + bone, Osteoclast precursors cultured with bone slice; Oc, Osteoclasts culture; Oc + bone, Osteoclasts cultured with bone; Con, Control medium). N. migrated cells/FV, number of migrated cells per field of view. n = 3. **P < 0.01, Oc + bone versus other groups. (b) Transwell assays for the migration of human STRO-1+ BMSCs using BRCM with addition of individual neutralizing antibodies or noggin as indicated. Ab, antibody. n = 3. *P < 0.05, **P < 0.01. (c,d) ELISA (c) and Western blot (d) assays of TGF-β1 in BRCM. n = 3. **P < 0.01, Oc + bone versus other groups, human natural TGF-β1 protein used as a positive control. (e) Addition of human natural TGF-β1 protein to the TGF-β1-depleted BRCM rescued the induction of migration. n = 3. **P < 0.01 versus BRCM alone. (f,g) Active TGF-β1 detected by ELISA in BRCM prepared from osteoclast precursors or osteoclasts with bone slices of either Tgfb1+/− mice (KO bone) or their wild-type littermates (WT bone) (f), and Transwell migration analysis of human STRO-1+ BMSCs induce by these BRCM (g). n = 3. **P < 0.01.
Figure 2
Figure 2
Tgfb1−/−Rag2−/− mice show decreased bone mass. (a) Representative images of three dimensional micro-computed tomography (μCT) of the whole right femora from three month-old Tgfb1+/+Rag2−/− and Tgfb1−/−Rag2−/− mice. Scale bar, 2 mm. (b–d) Structure parameters, including bone volume fraction (BV/TV, b), trabecular thickness (Tb. Th, c) and trabecular separation (Tb. Sp, d) as measured by μCT. n = 5. **P < 0.01. (e) Images of histological sections of three month-old mouse femora stained by HE. Scale bar, 1 mm. (f,g) Bone histomorphometric analysis in the femora of three month-old mice. Number of osteoblasts per tissue area (N. Ob/T. Ar) (f) and number of osteoclasts per tissue area (N. Oc/T. Ar) (g) were measured. n=5. **P < 0.01. N. S., not significant. (h) Immunostaining of Runx2 positive cells in three month-old Tgfb1+/+Rag2−/− and Tgfb1−/−Rag2−/− mice. Scale bar, 25 μm. n=5. **P < 0.01. (i,j) CFU-F formation and alkaline phosphates (AP) staining after osteogenic medium induction in BMSCs harvested from three month-old Tgfb1+/+Rag2−/− and Tgfb1−/−Rag2−/−mice (i). Scale bar, 0.5 cm. n = 3. N. S., not significant. These BMSCs were also stained with Alizarin Red after 21 days of induction with or without osteogenic medium, and the amount of Alizarin Red staining was measured by the absorption of 450 nm (j). Scale bar, 50 μm. n = 3. N. S., not significant.
Figure 3
Figure 3
Migration of the implanted BMSCs to bone resportive sites decreases in Tgfb1−/− mice. (a) FACS of CD29+Sca-1+CD45CD11b BMSCs. (b) Flow cytometry of the sorted cells. (c) CFU-F formation and AP staining of the sorted cells induced with or without osteogenic medium. (d) von Kossa and Alizarin Red staining of the sorted cells induced with or without osteogenic medium for 21 days. (e) Migration of the sorted cells induced by BRCM, with or without TβRI inhibitor (SB-505124) treatment. n = 3. **P < 0.01 versus Control medium, ##P < 0.01 versus BRCM without TβR1 inhibitor. (f) The sorted cells infected with GFP-retrovirus (left panel) were confirmed by immunocytochemisty staining (ICC) for GFP expression (bottom panel), and were transplanted to mouse femur marrow cavity (right panel). (g) Images of the femur sections from three month-old mice transplanted with GFP-labeled mouse BMSCs co-stained with TRAP and the antibody to GFP. Red arrows indicate TRAP positive osteoclasts. Black arrows indicate GFP positive donor cells. B, bone. (h) Counts of GFP positive cells on bone surface one week after transplantation (N. GFP+ cells/B. Pm: Number of GFP positive cells on bone surface) or in bone matrix four weeks after transplantation (N. GFP+ cells/T. Ar: Number of GFP positive cells in bone tissue area). n = 5. **P < 0.01. (i,j) Images (i) and counts (j) of human STRO-1+CD45BMSCs transplanted into mouse femur cavities detected by antibodies to HLA-A and RUNX2. n = 5. **P < 0.01. Scale bars, 25 μm.
Figure 4
Figure 4
SMAD signaling pathway mediates TGF-β1-induced migration of BMSCs. (a) Migration of human STRO-1+ BMSCs treated with or without TβRI inhibitor (SB-505124). n = 3. *P < 0.05, **P < 0.01 versus TβR1 inhibitor 0 nM. (b) Phosphorylation of SMAD2/3 (p-SMAD2/3) and cell migration induced by TGFβ1 in the BMSCs expressing GFP or SMAD7. n = 3. **P < 0.01. (c) BRCM-induced migration of the human STRO-1+ BMSCs transfected with siRNAs. Western blots of SMADs and ACTIN in these human STRO-1+ BMSCs indicted in the upper panels. n = 4. **P < 0.01 versus siGFP group. (d) Migration of Smad4-deleted primary mouse BMSCs induced by BRCM. Western bolts of Smad4 and Actin in these mouse BMSCs indicated in the upper panels. n = 3. **P < 0.01. (e,f) Interruption of TGF-β1 signaling in vivo inhibited the migration of BMSCs. The GFP-labeled mouse BMSCs sorted by FACS were transplanted together with TβRI inhibitor (SB-505124), human natural TGF-β1 or vehicle into Tgfb1+/+Rag2−/−mice, and the sections were detected with TRAP staining and immunostaining for GFP (e). Red arrows indicate TRAP positive osteoclasts. Black arrows indicate GFP positive donor cells. Scale bar, 25 μM. B, bone. Counts of GFP positive cells on bone surface (N. GFP+ cells/B. Pm) were shown in (f). n = 5. **P < 0.01 versus vehicle.
Figure 5
Figure 5
Bone resorption is uncoupled with bone formation in CED transgenic mice. (a) The protein levels of latent and active TGF-β1 in conditioned medium prepared from HEK-293 cells transfected with WT TGF-β1 or CED TGF-β1 mutant expression plasmids, human natural TGFβ1 loaded as a positive control. (b) Conditioned medium prepared in (a) induces migration of human STRO-1+ BMSCs. n = 3. *P < 0.05; **P < 0.01 versus WT. (c) The amount of active TGF-β1 in the bone marrow was measured by ELISA. n = 10. **P < 0.01 versus WT. N. S., not significant. (d) Radiography of right lower limbs of WT, TGF-β1-WT, and TGF-β1-CED mice at different ages. Arrows indicate the progressive diaphyseal dysplasia in TGF-β1-CED mice. Ratio of number of mice with fractures to total number of mice was counted. (e) Right femora images of one month-old male WT, TGF-β1-WT, and TGF-β1-CED mice. Arrow indicates diaphyseal dysplasia in TGF-β1-CED mice. (f) Three dimensional images of μCT from whole right tibiae of WT, TGF-β1-WT, and TGF-β1-CED mice. Scale bar, 2 mm. (g) Quantitative μCT image analysis of the whole tibiae. Total BV/TV: total bone volume of tibia per tissue volume. n = 10. N. S., not significant. (h) Continuous scanning of total BV/TV (0.5 mm width) of tibiae cross section by μCT as the distance from growth plate. (i) Tibiae sections of three month-old WT, TGF-β1-WT, and TGF-β1-CED mice were stained with antibody to osteocalcin (black arrows) and with TRAP staining (red arrows). B, bone. Scale bar, 25 μm.
Figure 6
Figure 6
TβRI inhibitor partially rescues uncoupled bone remodeling in TGF-β1-CED mice. Two month-old male TGF-β1-CED mice without fractures were injected intraperitoneally with either vehicle or SB-505124, a TβRI inhibitor, at different dosages (10 or 30 mg kg−1) each day for seven weeks. (a) Radiography of right tibiae of mice before and after treatment from the indicated treatment groups. Ratio of number of mice with fractures to total number of mice after treatment was counted. (b) Tree dimensional μCT images and total BV/TV of tibiae from the indicated treatment groups. Scale bar, 2 mm. n = 15. N. S., not significant. (c) Continuous scanning of total BV/TV (0.5 mm width) of tibia cross section by μCT shown as the distance from growth plate. Three individual mice in TGF-β1-CED with vehicle (vehicle 1–3) and SB-505124 30 mg kg−1 (Inhibitor 1–3) treatment groups are presented respectively. (d) Tibiae sections from the indicated treatment groups were stained with antibody to osteocalcin for osteoblasts (black arrows) and with TRAP staining for osteoclasts (red arrows). Scale bar, 25 μm.

Comment in

References

    1. Teitelbaum SL. Bone resorption by osteoclasts. Science. 2000;289:1504–1508. - PubMed
    1. Abe E, et al. TSH is a negative regulator of skeletal remodeling. Cell. 2003;115:151–162. - PubMed
    1. Zaidi M. Skeletal remodeling in health and disease. Nature Medicine. 2007;13:791–801. - PubMed
    1. Hill PA. Bone remodelling. Br J Orthod. 1998;25:101–107. - PubMed
    1. Janssens K, et al. Mutations in the gene encoding the latency-associated peptide of TGF-beta 1 cause Camurati-Engelmann disease. Nature Genetics. 2000;26:273–275. - PubMed

Publication types

MeSH terms

Substances