A model of postural control in quiet standing: robust compensation of delay-induced instability using intermittent activation of feedback control
- PMID: 19584944
- PMCID: PMC2704954
- DOI: 10.1371/journal.pone.0006169
A model of postural control in quiet standing: robust compensation of delay-induced instability using intermittent activation of feedback control
Erratum in
- PLoS One. 2009;4(7). doi: 10.1371/annotation/96e08e7f-22f0-445d-8fb3-fe7b071d0a3a
Abstract
The main purpose of this study is to compare two different feedback controllers for the stabilization of quiet standing in humans, taking into account that the intrinsic ankle stiffness is insufficient and that there is a large delay inducing instability in the feedback loop: 1) a standard linear, continuous-time PD controller and 2) an intermittent PD controller characterized by a switching function defined in the phase plane, with or without a dead zone around the nominal equilibrium state. The stability analysis of the first controller is carried out by using the standard tools of linear control systems, whereas the analysis of the intermittent controllers is based on the use of Poincaré maps defined in the phase plane. When the PD-control is off, the dynamics of the system is characterized by a saddle-like equilibrium, with a stable and an unstable manifold. The switching function of the intermittent controller is implemented in such a way that PD-control is 'off' when the state vector is near the stable manifold of the saddle and is 'on' otherwise. A theoretical analysis and a related simulation study show that the intermittent control model is much more robust than the standard model because the size of the region in the parameter space of the feedback control gains (P vs. D) that characterizes stable behavior is much larger in the latter case than in the former one. Moreover, the intermittent controller can use feedback parameters that are much smaller than the standard model. Typical sway patterns generated by the intermittent controller are the result of an alternation between slow motion along the stable manifold of the saddle, when the PD-control is off, and spiral motion away from the upright equilibrium determined by the activation of the PD-control with low feedback gains. Remarkably, overall dynamic stability can be achieved by combining in a smart way two unstable regimes: a saddle and an unstable spiral. The intermittent controller exploits the stabilizing effect of one part of the saddle, letting the system evolve by alone when it slides on or near the stable manifold; when the state vector enters the strongly unstable part of the saddle it switches on a mild feedback which is not supposed to impose a strict stable regime but rather to mitigate the impending fall. The presence of a dead zone in the intermittent controller does not alter the stability properties but improves the similarity with biological sway patterns. The two types of controllers are also compared in the frequency domain by considering the power spectral density (PSD) of the sway sequences generated by the models with additive noise. Different from the standard continuous model, whose PSD function is similar to an over-damped second order system without a resonance, the intermittent control model is capable to exhibit the two power law scaling regimes that are typical of physiological sway movements in humans.
Conflict of interest statement
Figures


 .
.
 and the tail-end is
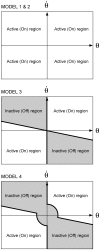
  . The PD controller is turned on and off, respectively, if the tail-end of the segment is located in the on (white) and off (gray-shaded) regions in the phase plane. Dotted lines are the stable manifold (arrow heads directing the equilibrium) and the unstable manifold (arrow heads departing away from the equilibrium). A: A typical orbit of eq. 3 when the proportional gain P of the PD controller is small. B: A typical orbit of eq. 3 when the gain P is large.
 are related to the switching mechanism of the controller. (The shaded areas indicate that the PD-control is switched off.) Σ is also used as the section for the computation of the map. Two typical orbits from Σ to Σ are shown (thick curves) for two different values of the proportional controller gain P: s→p
1 →p
2 →p
3 →s' and s→q
1 →q
2 →q
3 →s'. The thin lines display the PD-on flows (unstable spiral) and the PD-off flow (saddle with a stable manifold).
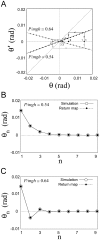
 of a leading edge placed on Σ is given, and the subsequent transverse angles of the leading edge across Σ are obtained by
  and
and  . B and C: A sequence of the tilt angles when the state of the system passes through the section Σ obtained by iterative use of the map in the panel A (filled points) and by the DDE simulation (open circles) for Model 3 with a = −0.4 s−1, and they showed a good agreement. The sequence toward the equilibrium of the sway angle is monotonic in B (P/mhg = 0.54) and oscillatory in C (P/mhg = 0.64).


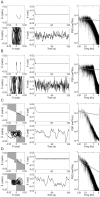
 ), D = 10 Nms/rad, a = −0.4 s−1. Right panel: P = 470 Nm/rad (
 ), D = 10 Nms/rad, a = −0.4 s−1. For Models 3 and 4 with a = −0.4 s−1, the optimal the optimal value of P for the stability is about 60% of mgh (i.e.
  ) regardless the value of D. The values of P in the left and right panels are smaller and larger than the optimal value of P, respectively.
References
-
- Casadio M, Morasso P, Sanguineti V. Direct measurement of ankle stiffness during quiet standing: Implications for control modelling and clinical application. Gait & Posture. 2005;21:410–424. - PubMed
-
- Peterka R. Postural control model interpretation of stabilogram diffusion analysis. Biological Cybernetics. 2000;82:335–343. - PubMed
-
- Maurer C, Peterka R. A new interpretation of spontaneous sway measures based on a simple model of human postural control. Journal of Neurophysiology. 2005;93:189–200. - PubMed
-
- Masani K, Popovic MR, Nakazawa K, Kouzaki M, Nozaki D. Importance of body sway velocity information in controlling ankle extensor activities during quiet stance. Journal of Neurophysiology. 2003;90:3774–3782. - PubMed
Publication types
MeSH terms
LinkOut - more resources
Full Text Sources
Medical

