

High density DNA array analysis reveals distinct genomic profiles in a subset of gastrointestinal stromal tumors
- PMID: 19585585
- PMCID: PMC2830286
- DOI: 10.1002/gcc.20689
High density DNA array analysis reveals distinct genomic profiles in a subset of gastrointestinal stromal tumors
Abstract
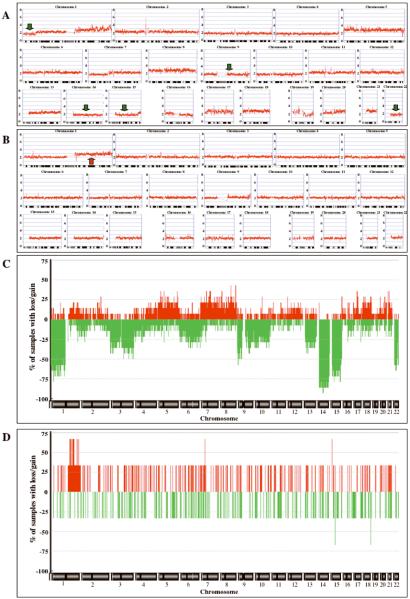
Gastrointestinal stromal tumors (GISTs) generally harbor activating mutations in KIT or platelet-derived growth facter receptor (PDGFRA). Mutations in these receptor tyrosine kinases lead to dysregulation of downstream signaling pathways that contribute to GIST pathogenesis. GISTs with KIT or PDGFRA mutations also undergo secondary cytogenetic alterations that may indicate the involvement of additional genes important in tumor progression. Approximately 10-15% of adult and 85% of pediatric GISTs do not have mutations in KIT or in PDGFRA. Most mutant adult GISTs display large-scale genomic alterations, but little is known about the mutation-negative tumors. Using genome-wide DNA arrays, we investigated genomic imbalances in a set of 31 GISTs, including 10 KIT/PDGFRA mutation-negative tumors from nine adults and one pediatric case and 21 mutant tumors. Although all 21 mutant GISTs exhibited multiple copy number aberrations, notably losses, eight of the 10 KIT/PDGFRA mutation-negative GISTs exhibited few or no genomic alterations. One KIT/PDGFRA mutation-negative tumor exhibiting numerous genomic changes was found to harbor an alternate activating mutation, in the serine-threonine kinase BRAF. The only other mutation-negative GIST with significant chromosomal imbalances was a recurrent metastatic tumor found to harbor a homozygous deletion in chromosome arm 9p. Similar findings in several KIT-mutant GISTs identified a minimal overlapping region of deletion of approximately 0.28 Mbp in 9p21.3 that includes only the CDKN2A/2B genes, which encode inhibitors of cell-cycle kinases. These results suggest that GISTs without activating kinase mutations, whether pediatric or adult, generally exhibit a much lower level of cytogenetic progression than that observed in mutant GISTs.
(c) 2009 Wiley-Liss, Inc.
Figures


References
-
- Assamaki R, Sarlomo-Rikala M, Lopez-Guerrero JA, Lasota J, Andersson LC, Llombart-Bosch A, Miettinen M, Knuutila S. Array comparative genomic hybridization analysis of chromosomal imbalances and their target genes in gastrointestinal stromal tumors. Genes, Chromosomes & Cancer. 2007;46(6):564–76. - PubMed
-
- Bohringer S, Godde R, Bohringer D, Schulte T, Epplen J. A software package for drawing ideograms automatically. Online Jornal of Bionformatics. 2002;1:51–61.
Publication types
MeSH terms
Substances
Grants and funding
LinkOut - more resources
Full Text Sources
Other Literature Sources
Research Materials
Miscellaneous
