. 2010 Feb;16(1):157-66.
doi: 10.1089/ten.TEC.2009.0179.

Layer by layer three-dimensional tissue epitaxy by cell-laden hydrogel droplets

Affiliations

Layer by layer three-dimensional tissue epitaxy by cell-laden hydrogel droplets

SangJun Moon et al. Tissue Eng Part C Methods. 2010 Feb.

Abstract

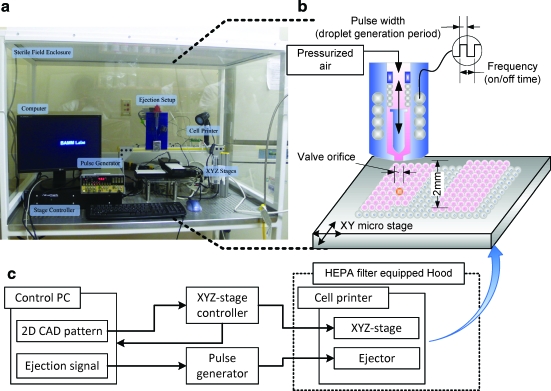
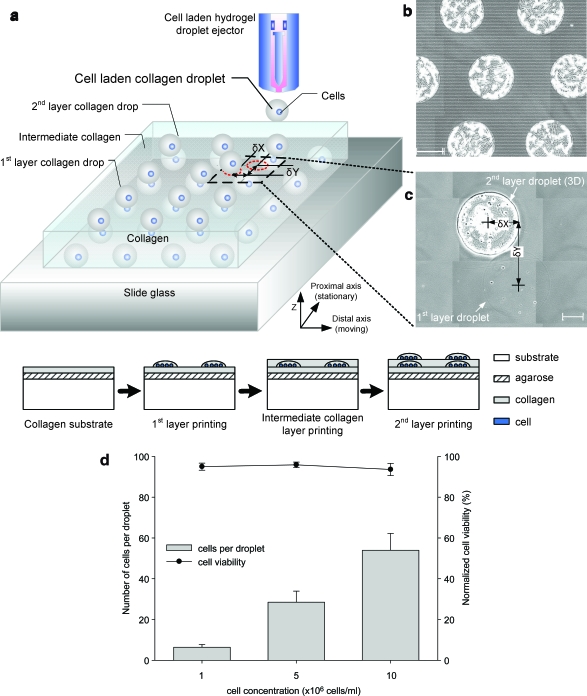
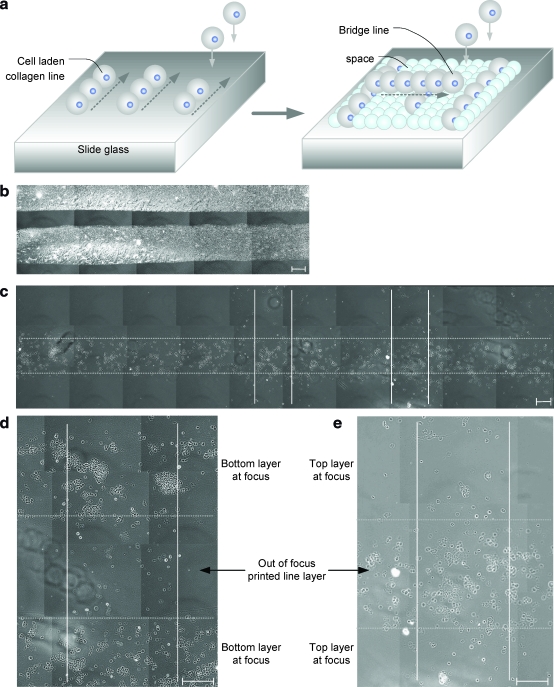
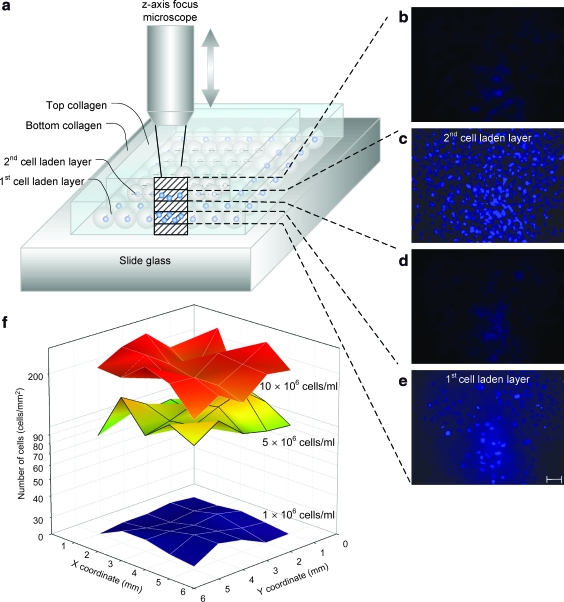
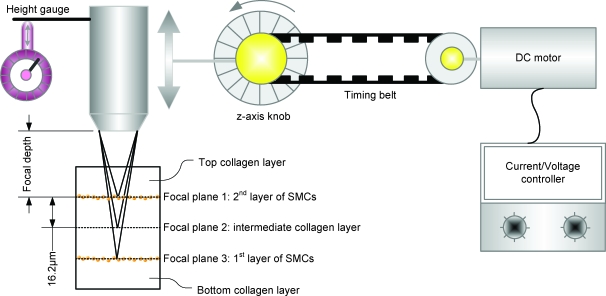
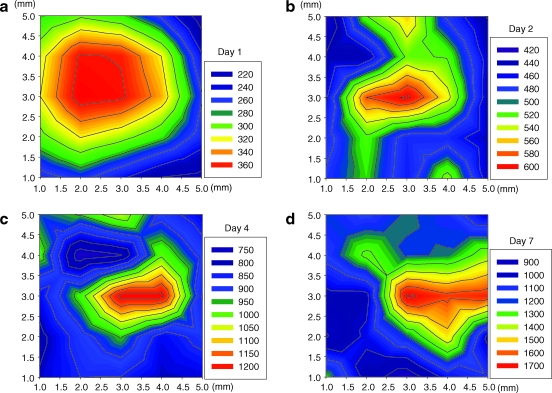
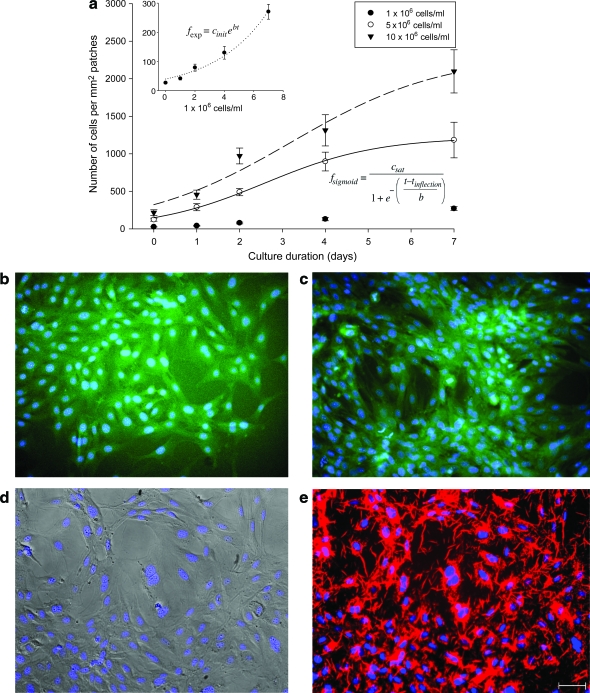
The ability to bioengineer three-dimensional (3D) tissues is a potentially powerful approach to treat diverse diseases such as cancer, loss of tissue function, or organ failure. Traditional tissue engineering methods, however, face challenges in fabricating 3D tissue constructs that resemble the native tissue microvasculature and microarchitectures. We have developed a bioprinter that can be used to print 3D patches of smooth muscle cells (5 mm x 5 mm x 81 microm) encapsulated within collagen. Current inkjet printing systems suffer from loss of cell viability and clogging. To overcome these limitations, we developed a system that uses mechanical valves to print high viscosity hydrogel precursors containing cells. The bioprinting platform that we developed enables (i) printing of multilayered 3D cell-laden hydrogel structures (16.2 microm thick per layer) with controlled spatial resolution (proximal axis: 18.0 +/- 7.0 microm and distal axis: 0.5 +/- 4.9 microm), (ii) high-throughput droplet generation (1 s per layer, 160 droplets/s), (iii) cell seeding uniformity (26 +/- 2 cells/mm(2) at 1 million cells/mL, 122 +/- 20 cells/mm(2) at 5 million cells/mL, and 216 +/- 38 cells/mm(2) at 10 million cells/mL), and (iv) long-term viability in culture (>90%, 14 days). This platform to print 3D tissue constructs may be beneficial for regenerative medicine applications by enabling the fabrication of printed replacement tissues.


Figures

FIG. 1.
FIG. 1.
Illustration of cell encapsulating droplet printing onto a substrate. (a) Image of the cell printing setup enclosed in a sterile field (Cleanroom International, Grand Rapids, MI, 13202). (b) Schematic of droplet ejector shows cells and collagen mixture flowing into the valve driven by constant air pressure. Mixture of cells and collagen solution was loaded into a 10 mL syringe reservoir. (c) Signal flow chart shows that the xyz stage is controlled by a controller that was synchronized with a pulse generator and a control PC. With programmed sequences to build a three-dimensional (3D) structure, the apparatus can control ejection conditions, that is, stage speed, pressure, valve on/off frequency, and valve opening duration. Color images available online at www.liebertonline.com/ten.
FIG. 2.
FIG. 2.
Printing platform for 3D cell-laden droplet printing. (a) Cell-laden hydrogel droplets are generated by a mechanical valve that is operated by a controlled pulse width (open period of the valve) and a frequency (on/off time of the valve) to generate required volume and timed placement of droplets onto a substrate, respectively (Fig. 1). Droplets are printed to form multiple layers of collagen; smooth muscle cell (SMC)–laden collagen droplet array (gray color sphere), intermediate collagen layer, and top SMC-laden droplet layer (blue color sphere). Image of a printed array of collagen droplets (b) and image of a multilayered array on a slide glass (c). A gray-colored droplet indicates the bottom layer of collagen shown in (c). δx and δy are measured between centers of each droplet in different layers. Mean and standard deviation values of x (distal axis) and y (proximal axis; moving axis) directional variations were 0.5 ± 4.9 and 18.0 ± 7.0 μm, respectively. (d) Number of cells per droplet and cell viability as a function of loading concentrations. Mean and standard deviation values of encapsulated cells were 6 ± 1, 29 ± 5, and 54 ± 8 cells per droplet in 1 × 106, 5 × 106, and 10 × 106 cells/mL, respectively. The cell printing platform showed 94.8 ± 0.8% average cell viability for three different concentrations compared to the culture flask. Each cell loading concentration had 94.9 ± 1.7%, 95.8 ± 1.3%, and 93.5 ± 3.0% cell viability. Scale bar: 200 μm. Color images available online at www.liebertonline.com/ten.
FIG. 3.
FIG. 3.
Printing of cells in lines of hydrogel microstructures. (a) Illustration of printed droplets in a line pattern. Top layer of the line pattern form a 3D structure like a bridge separated by a spacing layer of hydrogel. (b, c) Dot and solid lines represent the edge of bottom and top collagen lines; dried collagen line pattern in (b) and multilayered line pattern in (c). (d, e) Magnified images show cross-patterned lines on separate layers. The top and bottom layers are shown with two focused images: bottom focused image in (d) and top focused image in (e). Scale bar: 200 μm. Color images available online at www.liebertonline.com/ten.
FIG. 4.
FIG. 4.
Focal images of a printed 3D SMC tissue construct and two-dimensional cell seeding distribution. (a) Illustration of 3D patch imaging. The distance between each imaged layer is 16.2 μm which is controlled by timed imaging and moving speed of a z-axis knob (Fig. 5). (b–e) Focal images of 3D patch layers; top layer of printed collagen in (b), second layer of SMC patch in (c), intermediate collagen layer in (d), and first layer of SMC patch in (e). (f) Cell distribution of two-dimensional patch of 1, 5, and 10 million cells/mL concentration after printing (day 0). Each patch size is 5 × 5 mm. Average number and standard deviation of printed cells for each patch were 26 ± 2 cells/mm2 (average ± standard deviation) at 1 × 106 cells/mL, 122 ± 20 cells/mm2 at 5 × 106 cells/mL, and 216 ± 38 cells/mm2 at 10 × 106 cells/mL. The number of cells is represented in log scale for comparison between 1 × 106 and 10 × 106 cells/mL. Scale bar: 100 μm. Color images available online at www.liebertonline.com/ten.
FIG. 5.
FIG. 5.
Focal 3D imaging method using a motorized microscope. A direct current motor was connected to control the z-axis knob of a fluorescence microscope body by a timing belt. Each image was taken at a scheduled time by a charge-coupled device camera control software. The distance of each layer was calculated by the reference index of the microscope (65 μm/360°), motor speed (180°/s), and imaging time control (0.5 s/image). These conditions gave a resolution of 16.2 μm separation between each image for an 81-μm thick patch (five layers). Color images available online at www.liebertonline.com/ten.
FIG. 6.
FIG. 6.
Cell distribution of printed SMC patch in culture. (a–d) Quantification of cell distribution and cell proliferation within a single layer of printed SMC patch: day(s) 1 in (a), 2 in (b), 4 in (c), and 7 in (d) for 5 × 106 cells/mL. Each patch size is 5 × 5 mm (xy-axis index). The cell distribution of printed cells for each patch was 289 ± 47 cells/mm2 (average ± standard deviation) in (a), 489 ± 48 cells/mm2 in (b), 897 ± 125 cells/mm2 in (c), and 1183 ± 236 cells/mm2 in (d). Color images available online at www.liebertonline.com/ten.
FIG. 7.
FIG. 7.
Characterization of printed SMC patch in culture. The proliferation graph shows increasing number of cells over a period of time in collagen patches for three initial cell concentrations (Cinit), that is, 1 × 106, 5 × 106, and 10 × 106 cells/mL. (a) The total number of cells per square millimeter in three different initial printing concentrations were measured from day 0 to 7. Inset represents an enlarged figure of 1 × 106 cells/mL initial cell loading density. After 7 days of culturing (Csat), 270 ± 25, 1183 ± 236, and 2097 ± 287 cells/mm2 were observed for 1 × 106, 5 × 106, and 10 × 106 cells/mL, respectively. The inflection time (tinflection) of sigmoid regression curves was 2.6 days for 5 × 106 cells/mL and 3.2 days for 10 × 106 cells/mL. In case of 26 ± 1.7 cells/mm2 initial cell loading density, proliferation rate of cells showed an exponential increment. The unknown factor for cell proliferation b is a factor of each exponent and sigmoid regression functions, 0.2 for 1 × 106 cells/mL, 1.3 for 5 × 106 cells/mL, and 1.7 for 10 × 106 cells/mL. (b–e) Stained SMC patch images for 1 × 106 cells/mL concentration after day(s) in culture: day 4 culture of SMC patch stained with 4′,6-diamidino-2-phenylindole (DAPI) (blue) and actin (green) under a light microscope (10×) in (b), day 7 SMCs stained with DAPI and actin in (c), SMCs stained with DAPI (blue) at day 14 in culture in (d), SMCs stained with DAPI and connexin-43 (red) at day 14 in culture in (e). Scale bar: 100 μm. Color images available online at www.liebertonline.com/ten.

References

    1. Langer R. Vacanti J.P. Tissue engineering. Science. 1993;260:920. - PubMed
    1. Atala A. Bauer S.B. Soker S. Yoo J.J. Retik A.B. Tissue-engineered autologous bladders for patients needing cystoplasty. Lancet. 2006;367:1241. - PubMed
    1. Macchiarini P. Jungebluth P. Go T. Asnaghi M.A. Rees L.E. Cogan T.A. Dodson A. Martorell J. Bellini S. Parnigotto P.P. Dickinson S.C. Hollander A.P. Mantero S. Conconi M.T. Birchall M.A. Clinical transplantation of a tissue-engineered airway. Lancet. 2008;372:2023. - PubMed
    1. Khademhosseini A. Langer R. Borenstein J. Vacanti J.P. Microscale technologies for tissue engineering and biology. Proc Natl Acad Sci USA. 2006;103:2480. - PMC - PubMed
    1. Nerem R.M. Cellular engineering. Ann Biomed Eng. 1991;19:529. - PubMed

Publication types

Substances

LinkOut - more resources