. 2009 Sep 4;284(36):24123-32.
doi: 10.1074/jbc.M109.007393. Epub 2009 Jul 8.

Lysophosphatidic acid enhances pulmonary epithelial barrier integrity and protects endotoxin-induced epithelial barrier disruption and lung injury

Affiliations

Lysophosphatidic acid enhances pulmonary epithelial barrier integrity and protects endotoxin-induced epithelial barrier disruption and lung injury

Donghong He et al. J Biol Chem. .

Abstract

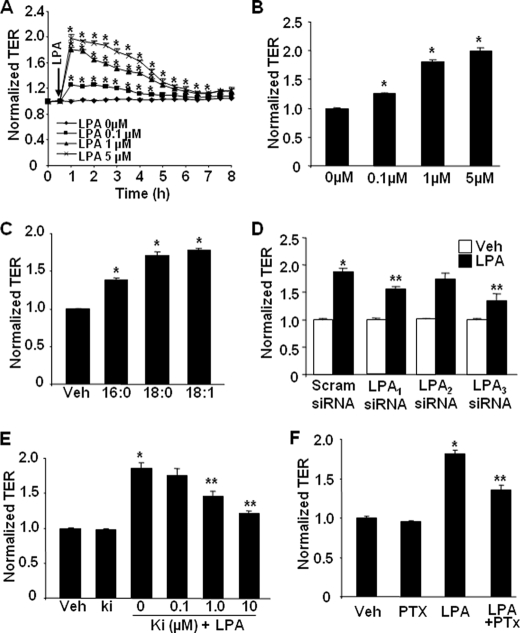
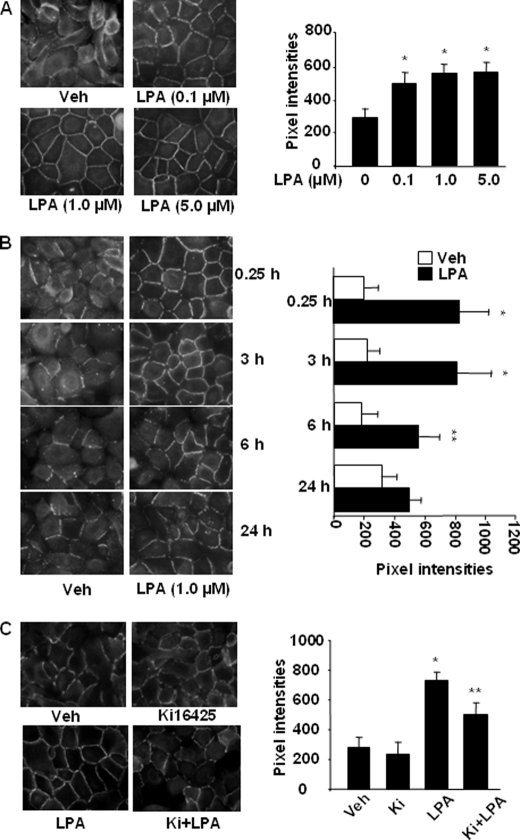
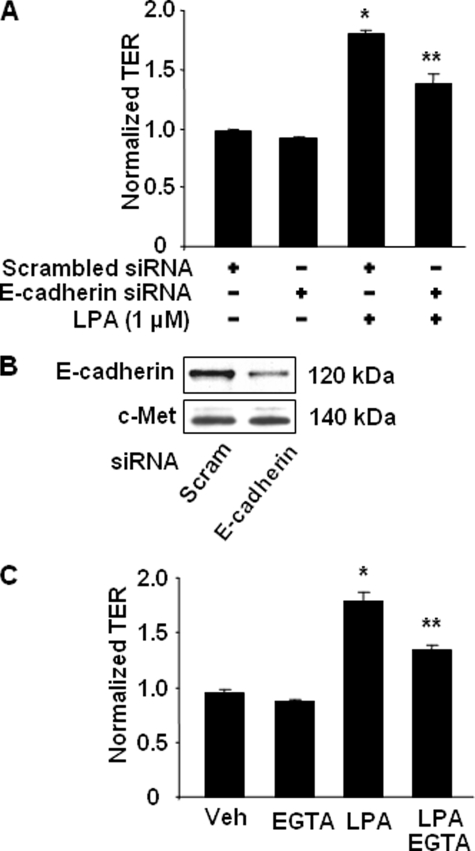
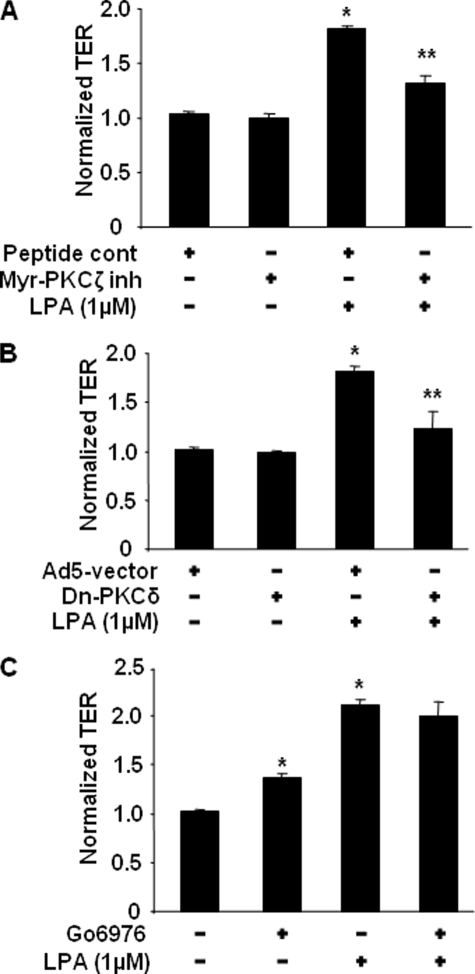
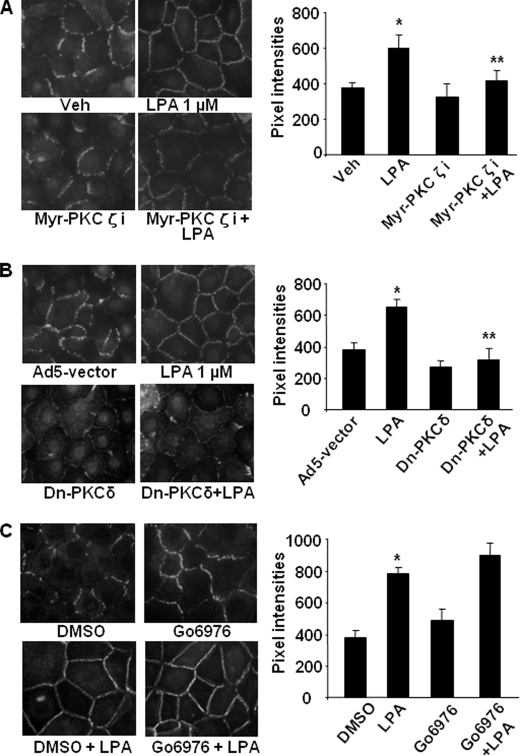
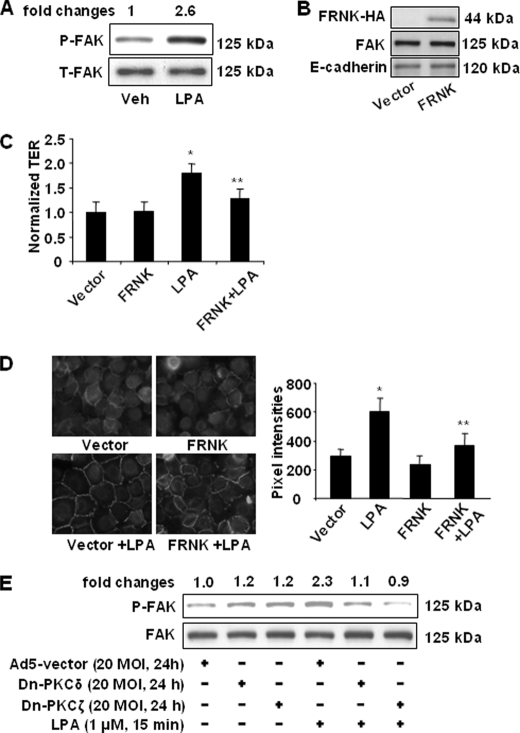
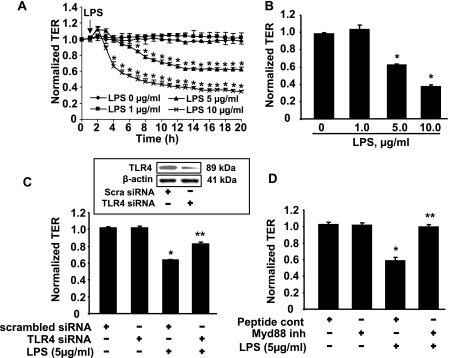
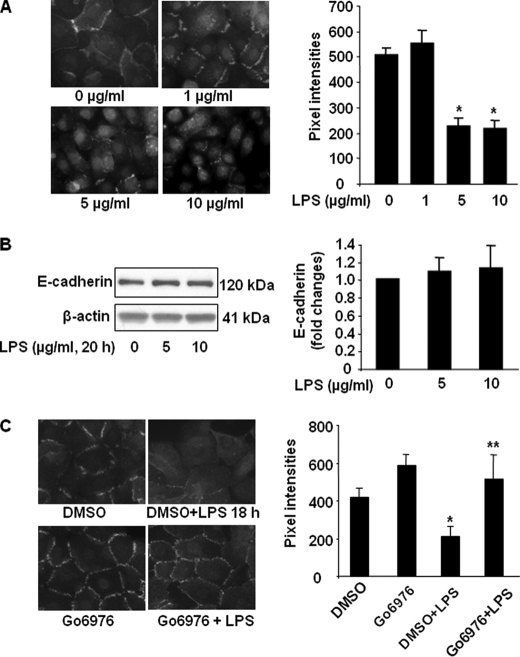
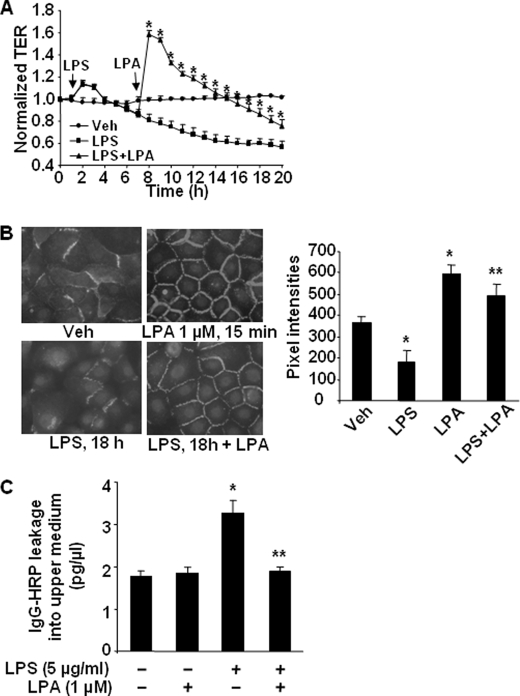
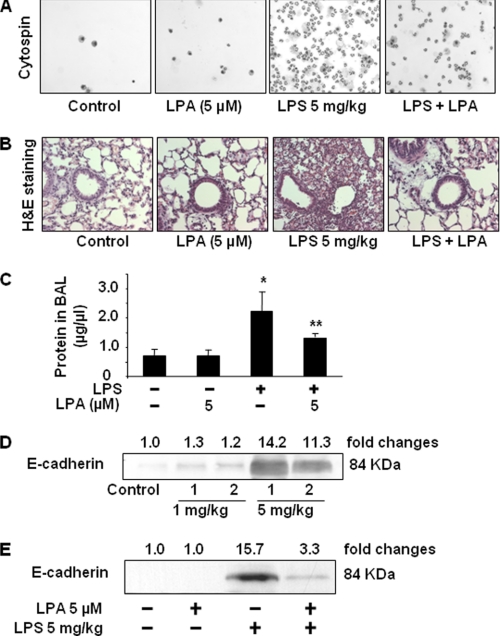
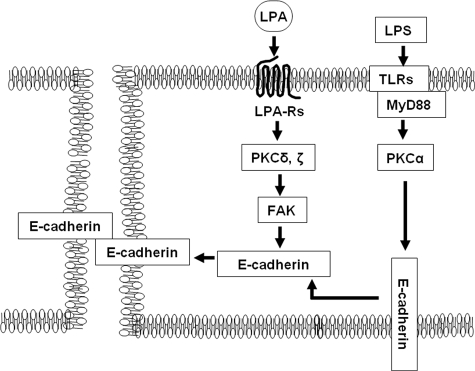
Lysophosphatidic acid (LPA), a bioactive phospholipid, induces a wide range of cellular effects, including gene expression, cytoskeletal rearrangement, and cell survival. We have previously shown that LPA stimulates secretion of pro- and anti-inflammatory cytokines in bronchial epithelial cells. This study provides evidence that LPA enhances pulmonary epithelial barrier integrity through protein kinase C (PKC) delta- and zeta-mediated E-cadherin accumulation at cell-cell junctions. Treatment of human bronchial epithelial cells (HBEpCs) with LPA increased transepithelial electrical resistance (TER) by approximately 2.0-fold and enhanced accumulation of E-cadherin to the cell-cell junctions through Galpha(i)-coupled LPA receptors. Knockdown of E-cadherin with E-cadherin small interfering RNA or pretreatment with EGTA (0.1 mm) prior to LPA (1 microm) treatment attenuated LPA-induced increases in TER in HBEpCs. Furthermore, LPA induced tyrosine phosphorylation of focal adhesion kinase (FAK) and overexpression of the FAK inhibitor, and FAK-related non-kinase-attenuated LPA induced increases in TER and E-cadherin accumulation at cell-cell junctions. Overexpression of dominant negative protein kinase delta and zeta attenuated LPA-induced phosphorylation of FAK, accumulation of E-cadherin at cell-cell junctions, and an increase in TER. Additionally, lipopolysaccharide decreased TER and induced E-cadherin relocalization from cell-cell junctions to cytoplasm in a dose-dependent fashion, which was restored by LPA post-treatment in HBEpCs. Intratracheal post-treatment with LPA (5 microm) reduced LPS-induced neutrophil influx, protein leak, and E-cadherin shedding in bronchoalveolar lavage fluids in a murine model of acute lung injury. These data suggest a protective role of LPA in airway inflammation and remodeling.


Figures

FIGURE 1.
FIGURE 1.
LPA induces increases in TER in HBEpCs. A, HBEpCs grown on ECIS gold electrodes were challenged with LPA at different concentrations (0.1–5 μm), and changes in TER were measured with the ECIS. B shows changes in TER at 1 h of LPA treatment. *, p < 0.01, compared with vehicle control. C, HBEpCs grown on ECIS gold electrodes were challenged with 1 μg/ml 16:0LPA, 18:0LPA, and 18:1LPA, and changes in TER at 1 h were measured with the ECIS. *, p < 0.01, compared with vehicle (Veh) control. D, HBEpCs grown on ECIS gold electrodes were transfected with 100 nm scrambled (Scram) siRNA, LPA1 siRNA, LPA2 siRNA, or LPA3 siRNA for 72 h, and then cells were challenged with LPA (1 μm). The changes in TER at 1 h were measured with ECIS. *, p < 0.01, compared with scrambled siRNA; **, p < 0.01, compared with scrambled siRNA + LPA. E, HBEpCs grown on ECIS gold electrodes were pretreated with Ki16425 (Ki) (0.1–10 μm) for 1 h, and then cells were challenged with LPA (1 μm). The changes of TER at 1 h were measured with ECIS. *, p < 0.01, compared with LPA-treated cells; **, p < 0.01, compared with LPA treatment. F, HBEpCs grown on ECIS gold electrodes were pretreated with pertussis toxin (PTx) (100 ng/ml, 4 h) prior to LPA (1 μm) challenge, and changes in TER at 1 h were measured with ECIS. *, p < 0.01, compared with vehicle control; **, p < 0.01, compared with LPA treatment.
FIGURE 2.
FIGURE 2.
LPA induces E-cadherin accumulation at cell-cell junctions. A, HBEpCs grown on glass chamber slides were treated with LPA (0.1, 1.0, and 5.0 μm) for 15 min, and E-cadherin localization was detected by immunofluorescence staining with an E-cadherin antibody (k-20). The intensities of E-cadherin at cell-cell junctions were measured by MetaVue software. *, p < 0.01, compared with vehicle (Veh) control. B, HBEpCs grown on glass chamber slides were treated with LPA (1 μm) for 15 min and 3, 6, and 24 h, and E-cadherin localization was detected by immunofluorescence staining with an E-cadherin antibody. The intensities of E-cadherin at cell-cell contacts were measured by MetaVue software. *, p < 0.01; **, p < 0.05, compared with vehicle control. C, HBEpCs grown on glass chamber slides were treated with Ki16425 (5 μm) for 1 h prior to LPA challenge (1 μm, 15 min), and E-cadherin localization was detected by immunofluorescence staining with an E-cadherin antibody. The intensities of E-cadherin at cell-cell contacts were measured by MetaVue software. *, p < 0.01, compared with vehicle control; **, p < 0.01, compared with LPA treatment.
FIGURE 3.
FIGURE 3.
LPA induces the increases in TER via E-cadherin. A, HBEpCs grown on ECIS gold electrodes were transfected with scrambled (Scram) siRNA (100 nm) or E-cadherin siRNA (100 nm) for 72 h and then treated with LPA (1 μm). The changes in TER at 1 h were measured with ECIS. *, p < 0.01, compared with scrambled siRNA; **, p < 0.01, compared with scrambled siRNA + LPA. B, Western blotting confirmed E-cadherin expression after E-cadherin siRNA transfection with antibodies to E-cadherin and c-Met. C, HBEpCs grown on ECIS gold electrodes were pretreated with EGTA (0.1 mm) for 0.5 h prior to LPA (1 μm) challenge. Changes in TER at 1 h were measured with ECIS. *, p < 0.01, compared with vehicle (Veh) control; **, p < 0.01, compared with LPA treatment.
FIGURE 4.
FIGURE 4.
PKCδ and PKCζ regulate LPA-induced increases in TER. HBEpCs grown on ECIS gold electrodes were treated with myr-PKCζ peptide inhibitor (10 μm, 24 h) (A), or infected with adenovirus empty vector or adenoviral dn-PKCδ (20 m.o.i., 24 h) (B), or were treated with Go6976 (5 μm, 1 h) (C) prior to LPA (1 μm) challenge. The changes of TER at 1 h were measured with ECIS. *, p < 0.01, compared with vehicle control; **, p < 0.01, compared with LPA treatment.
FIGURE 5.
FIGURE 5.
PKCδ and PKCζ regulate LPA-induced E-cadherin accumulation at cell-cell junctions. HBEpCs grown on glass chamber slides were treated with myr-PKCζ peptide inhibitor (10 μm, 1 h) (A), or infected with adenovirus empty vector or adenoviral dn-PKCδ (20 m.o.i., 24 h) (B), or treated with Go6976 (5 μm, 1 h) (C) prior to LPA (1 μm) challenge for 15 min. E-cadherin localization was detected by immunofluorescence staining with an E-cadherin antibody. The intensities of E-cadherin at cell-cell contacts were measured by MetaVue software. *, p < 0.01, compared with vehicle (Veh) control; **, p < 0.01, compared with LPA treatment.
FIGURE 6.
FIGURE 6.
FAK regulates LPA-induced pulmonary epithelial barrier function. A, HBEpCs grown on 6-well plates were challenged with LPA (1 μm) for 15 min. Cell lysates were analyzed by Western blotting with antibodies to phospho(Tyr-397)-FAK (P-FAK) and FAK. Changes in FAK phosphorylation are expressed as fold changes and normalized to total FAK (T-FAK). Shown are representative blots from three independent experiments. Veh, vehicle. B, HBEpCs were transfected with empty vector or HA-tagged FRNK plasmid (1 μg/ml) for 48 h. Cell lysates were analyzed by Western blotting with antibodies to HA tag, FAK, or E-cadherin. Shown are representative blots for three independent experiments. C, HBEpCs were transfected with empty vector or HA-tagged FRNK plasmid for 48 h and then challenged with LPA (1 μm). Changes in TER at 1 h were measured with ECIS. *, p < 0.01, compared with vector control; **, p < 0.01, compared with LPA treatment. D, HBEpCs were transfected with empty vector and HA-tagged FRNK plasmid for 48 h and then challenged with LPA (1 μm) for 15 min, and E-cadherin localization was detected by immunofluorescence staining with an E-cadherin antibody. The intensities of E-cadherin at cell-cell contacts were measured by MetaVue software. *, p < 0.01, compared with vector control; **, p < 0.01, compared with LPA treatment. E, HBEpCs were infected with dn-PKCδ and dn-PKCζ (20 m.o.i., 24 h) and then challenged with LPA (1 μm) for 15 min. Cell lysates were analyzed by Western blotting with antibodies to phospho(Tyr-397)-FAK and FAK. Changes in FAK phosphorylation are expressed as fold changes and normalized for total FAK (T-FAK). Shown are representative blots from three independent experiments.
FIGURE 7.
FIGURE 7.
LPS decreases TER in pulmonary epithelial cells. A, HBEpCs grown on ECIS gold electrodes were challenged with LPS (1, 5, and 10 μg/ml), and changes in TER were measured with ECIS. *, p < 0.01, compared with untreated cells. B shows changes in TER at 18 h of LPS treatment. *, p < 0.01, compared with vehicle control. C, HBEpCs grown on ECIS gold electrodes were transfected with scrambled siRNA (50 nm) or TLR4 siRNA (50 nm) for 48 h, and then cells were challenged with LPS (10 μg/ml). Changes in TER at 18 h were measured by ECIS. *, p < 0.01, compared with scrambled siRNA; **, p < 0.01, compared with scrambled siRNA + LPS. Inset shows TLR4 expression by Western blotting with an antibody specific to TLR4. D, HBEpCs grown on ECIS gold electrodes were treated with Myd88 peptide inhibitor (100 μm, 24 h) prior to LPS (5 μg/ml) challenge. The changes in TER at 18 h were measured with ECIS. *, p < 0.01, compared with vehicle control; **, p < 0.01, compared with LPS treatment.
FIGURE 8.
FIGURE 8.
LPS decreases E-cadherin localization at cell-cell contacts. A, HBEpCs grown on glass chamber slides were challenged with LPS (1, 5, and 10 μg/ml) for 18 h, and E-cadherin localization was detected by immunofluorescence staining with an E-cadherin antibody. The intensities of E-cadherin at cell-cell contacts were measured by MetaVue software. *, p < 0.01, compared with vehicle control. B, HBEpCs were challenged with LPS (5 and 10 μg/ml) for 18 h, and cell lysates were analyzed by Western blotting with specific antibodies to E-cadherin and β-actin. Shown are representative blots from three independent experiments. C, HBEpCs grown on glass chamber slides were treated with Go6976 (5 μm, 1 h) prior to LPS (5 μg/ml, 18 h) challenge. E-cadherin localization was detected by immunofluorescence staining with an E-cadherin antibody. The intensities of E-cadherin at cell-cell contacts were measured by MetaVue software. *, p < 0.01, compared with vehicle control; **, p < 0.01, compared with LPS treatment.
FIGURE 9.
FIGURE 9.
LPA post-treatment restores LPS-induced epithelial barrier disruption. A, HBEpCs grown on ECIS gold electrodes were challenged with LPS (5 μg/ml) for 6 h; cells were treated with LPA (1 μm), and changes in TER were measured with ECIS. *, p < 0.01, compared with LPS treatment. Veh, vehicle. B, HBEpCs grown on glass chamber slides were challenged with LPS (5 μg/ml) for 18 h, then cells were treated with LPA (1 μm) for 15 min, and E-cadherin localization was detected by immunofluorescence staining with an E-cadherin antibody. The intensities of E-cadherin at cell-cell contacts were measured by MetaVue software. *, p < 0.01, compared with vehicle control; **, p < 0.01, compared with LPS treatment. C, HBEpCs were grown on permeable inserts containing 0.4-μm pores. IgG-HRP was added to the lower compartment, and LPS (10 μg/ml) was added to the upper compartment for 1 h, followed by LPA (2 μm) addition for 8 h. The medium from upper compartment was collected, and the IgG-HRP levels were measured by enzyme-linked immunosorbent assay kit. *, p < 0.01, compared with vehicle control; **, p < 0.01, compared with LPS treatment.
FIGURE 10.
FIGURE 10.
LPA post-treatment reduces LPS-induced neutrophil influx and E-cadherin shedding in a murine model of ALI. 1 h following intratracheal LPS challenge (5 mg/kg body weight), mice (n = 5–6) were intratracheally instilled with LPA (5 μm in 25 μl of saline). After 24 h, differential cell counts in BAL fluids were performed by cytospin (A). B, lung tissues were examined by hematoxylin and eosin (H&E) staining. C, protein concentrations in BAL fluids were detected. *, p < 0.01, compared with control; **, p < 0.05, compared with LPS challenge. D, mice were intratracheally instilled with LPS (1 and 5 mg/kg body weight); BAL fluids were collected at 24 h, and then E-cadherin expression was detected in BAL fluids by Western blotting with antibody to mouse E-cadherin extracellular domain (DECMA-1). Shown are representative blots from 5 to 6 challenged mice. E, mice were intratracheally instilled with LPS (5 mg/kg body weight), and after 1 h LPA (5 μm in 25 μl saline) was administered intratracheally. BAL fluids were collected after 24 h, and E-cadherin shedding was detected by Western blotting with antibody to mouse E-cadherin extracellular domain (DECMA-1). Shown are representative blots from each group (n = 5–6) mice.
FIGURE 11.
FIGURE 11.
LPA protects LPS-induced airway epithelial barrier disruption through regulation of E-cadherin intracellular trafficking. Ligation of LPA to LPA receptor(s) activates PKCδ and PKCζ, which regulate E-cadherin accumulation at cell-cell junctions and airway epithelial barrier integrity. However, LPS activates PKCα, resulting in cytoplasm mislocalization of E-cadherin and disruption of airway epithelial barrier. LPA post-treatment reverses LPS-induced airway epithelial barrier disruption.

Similar articles

Cited by

References

    1. Budinger G. R., Sznajder J. I. (2006) Clin. Chest Med. 27, 655–669; abstract ix - PubMed
    1. Knight D. A., Holgate S. T. (2003) Respirology 8, 432–446 - PubMed
    1. Matthay M. A., Robriquet L., Fang X. (2005) Proc. Am. Thoracic Soc. 2, 206–213 - PubMed
    1. Zhao Y., Usatyuk P. V., Gorshkova I. A., He D., Wang T., Moreno-Vinasco L., Geyh A. S., Breysse P. N., Samet J. M., Spannhake E. W., Garcia J. G., Natarajan V. (2009) Am. J. Respir. Cell Mol. Biol. 40, 19–30 - PMC - PubMed
    1. Gourgoulianis K. I., Domali A., Molyvdas P. A. (1999) Mediat. Inflamm. 8, 261–263 - PMC - PubMed

Publication types

MeSH terms