. 2009 Oct 1;18(19):3544-52.
doi: 10.1093/hmg/ddp299. Epub 2009 Jul 7.

Inactive X chromosome-specific reduction in placental DNA methylation

Affiliations

Inactive X chromosome-specific reduction in placental DNA methylation

Allison M Cotton et al. Hum Mol Genet. .

Abstract

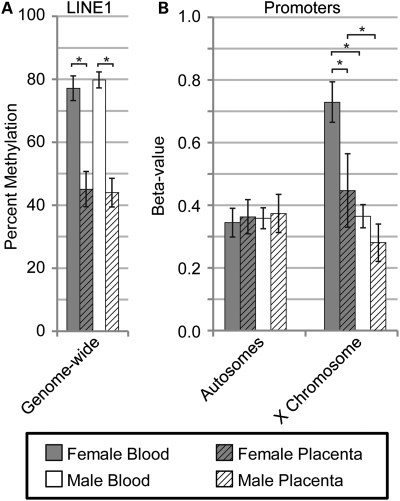
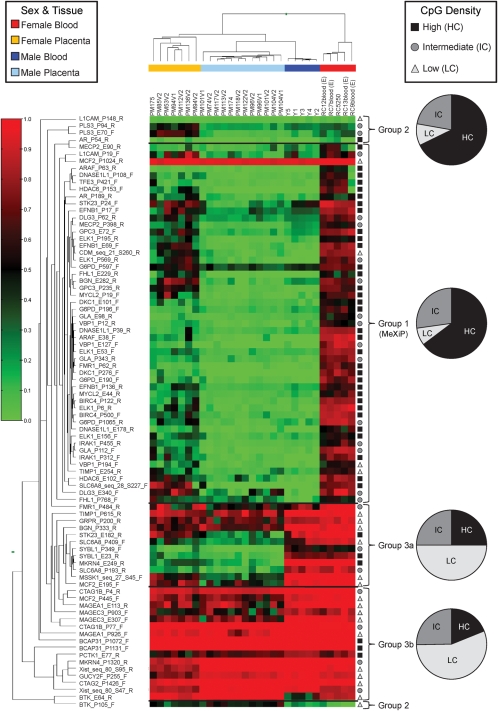
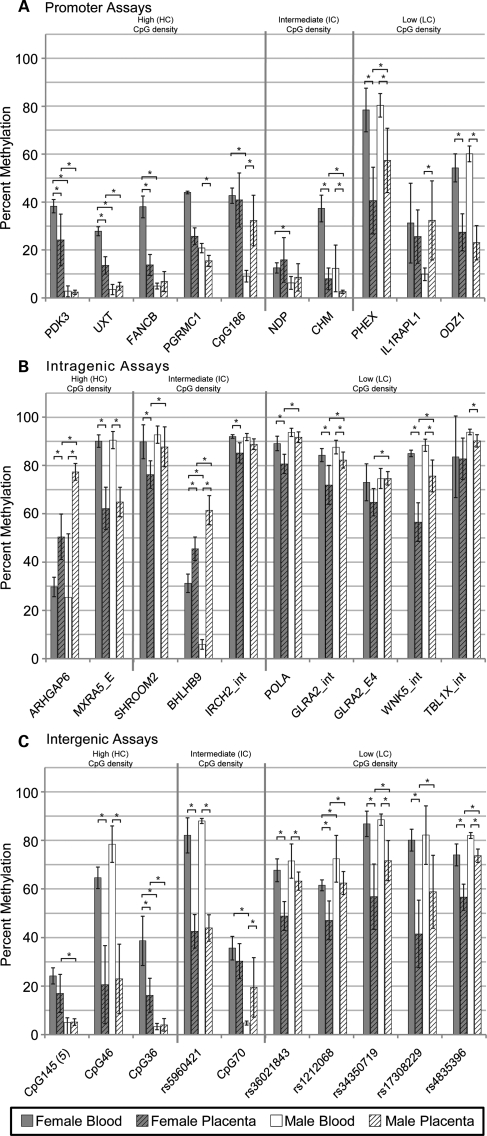
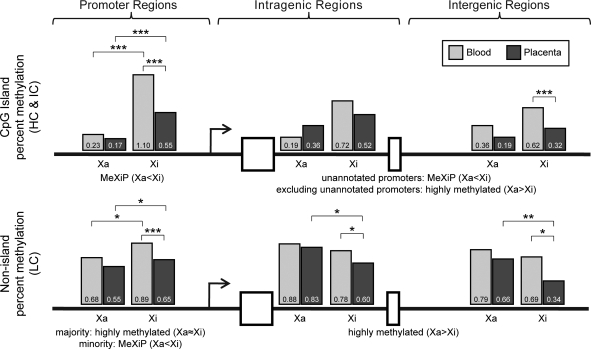
Genome-wide levels of DNA methylation vary between tissues, and compared with other tissues, the placenta has been reported to demonstrate a global decrease in methylation as well as decreased methylation of X-linked promoters. Methylation is one of many features that differentiate the active and inactive X, and it is well established that CpG island promoters on the inactive X are hypermethylated. We now report a detailed analysis of methylation at different regions across the X in male and female placenta and blood. A significant (P < 0.001) placental hypomethylation of LINE1 elements was observed in both males and females. Relative to blood placental promoter hypomethylation was only observed for X-linked, not autosomal promoters, and was significant for females (P < 0.0001) not males (P = 0.9266). In blood, X-linked CpG island promoters were shown to have moderate female methylation (66% across 70 assays) and low (23%) methylation in males. A similar methylation pattern in blood was observed for approximately 20% of non-island promoters as well as 50% of the intergenic or intragenic CpG islands, the latter is likely due to the presence of unannotated promoters. Both intragenic and intergenic regions showed similarly high methylation levels in male and female blood (68 and 66%) while placental methylation of these regions was lower, particularly in females. Thus placental hypomethylation relative to blood is observed globally at repetitive elements as well as across the X. The decrease in X-linked placental methylation is consistently greater in females than males and implicates an inactive X specific loss of methylation in the placenta.


Figures

Figure 1.
Figure 1.
Reduced placental methylation found at LINE1 repetitive elements and promoters on the X chromosome. Average level of methylation for female blood (grey), female placenta (grey hatched), male blood (white) and male placenta (white hatched) are shown with error bars (one standard deviation) based on the average sample deviation at a single site. Significance calculated using Mann–Whitney test with P < 0.001 (*). (A) LINE1 percent methylation as determined by pyrosequencing at LINE1 repetitive elements across the genome. (B) Illumina Golden Gate Promoter methylation array data averaged separately for 1421 sites on the autosomes and 84 X-linked sites. Beta-values represent average percent methylation.
Figure 2.
Figure 2.
Heatmap of methylation levels at 84 sites across the X chromosome demonstrates that the majority of X-linked promoter assays demonstrate MeXiP and are of high and intermediate CpG density while low CpG density assays tend to be highly methylated. Methylation levels determined by Illumina Golden Gate promoter methylation array are represented as a gradient from red (high methylation) to green (low methylation). BeadStudio software used the Manhattan Hierarchical Cluster Metric to group samples that were separated by tissue and sex (coding of samples as follows: yellow = female placenta, blue = male placenta, dark blue = male blood, orange = female blood). Assays were visually divided into four groups based on methylation trends. Group 1 shows high female methylation and low male in blood (MeXiP), group 2 shows low methylation in all samples and group 3 shows high methylation in both male and female blood. Group 3a had variable placenta methylation while group 3b had high methylation in the placenta. The CpG density of each assay, high (HC) (black square), intermediate (IC) (dark grey circle) or low (LC) (light grey triangle), is shown to the right and the assay names to the left of the heatmap. The percent of assays within each group based on CpG density is shown as a pie chart to the far right of the heatmap.
Figure 3.
Figure 3.
X-linked CpG island promoters show female-specific methylation, whereas methylation is high in both X-linked intragenic and intergenic regions in females and males. Average percent methylation from 30 pyrosequencing assays for six female blood (grey), six female placenta (grey hatched), six male blood (white) and six male placenta (white hatched). Each placenta was sampled from two sites within a single placenta for a total of 12 placental samples. Assays are separated into CpG density, high (HC), intermediate (IC) and low (LC), from the left to the right, by vertical lines. (A) Promoter assays; (B) intragenic assays; (C) intergenic assays. The region assayed is listed below each set of averages. Significance calculated using Mann–Whitney test with P < 0.01 (*). Error bars are one standard deviation.
Figure 4.
Figure 4.
Summary of methylation analyses showing placental reduction in methylation predominately on the Xi. Data from both Illumina and pyrosequencing are combined and shown separately for CpG island (HC & IC) assays and non-island (LC) assays in promoter regions, intragenic regions (includes both introns and exons) and intergenic regions. In order to combine Illumina GoldenGate data (which is only for promoter regions), we converted beta-values to percent methylation. These values were consistent with pyrosequencing data at the low range, but generally higher than pyrosequencing in the midrange, accounting for the Xi value over 1 for promoters. Percent methylation is the average of all CpGs in the indicated region. Percent methylation is divided into Xa and Xi with grey bars representing methylation in blood and black bars for placenta with the average percent methylation value written in each bar. The summary of the methylation trends for the different regions is described below each bar graph. Significance calculated using Mann–Whitney test with significance shown as P = 0.01 to 0.05 (*), P = 0.01 to 0.001 (**) and P < 0.001 (***).

References

    1. Ehrlich M., Gama-Sosa M.A., Huang L.-H., Midgett R.M., Kuo K.C., McCune R.A., Gehrke C. Amount and distribution of 5-methylcytosine in human DNA from different types of tissues or cells. Nucleic Acids Res. 1982;10:2709–2721. - PMC - PubMed
    1. Gama-Sosa M.A., Midgett R.M., Slagel V.A., Githens S., Kuo K.C., Gehrke C.W., Ehrlich M. Tissue-specific differences in DNA methylation in various mammals. Biochim. Biophys. Acta. 1983;740:212–219. - PubMed
    1. Fuke C., Shimabukuro M., Petronis A., Sugimoto J., Oda T., Miura K., Miyazaki T., Ogura C., Okazaki Y., Jinno Y. Age related changes in 5-methylcytosine content in human peripheral leukocytes and placentas: an HPLC-based study. Ann. Hum. Genet. 2004;68:196–204. - PubMed
    1. Hellmann-Blumberg U., Hintz M.F., Gatewood J.M., Schmid C.W. Developmental differences in methylation of human Alu repeats. Mol. Cell Biol. 1993;13:4523–4530. - PMC - PubMed
    1. Shen H.M., Nakamura A., Sugimoto J., Sakumoto N., Oda T., Jinno Y., Okazaki Y. Tissue specificity of methylation and expression of human genes coding for neuropeptides and their receptors, and of a human endogenous retrovirus K family. J. Hum. Genet. 2006;51:440–450. - PubMed

Publication types