Climate shaped the worldwide distribution of human mitochondrial DNA sequence variation
- PMID: 19586946
- PMCID: PMC2817182
- DOI: 10.1098/rspb.2009.0752
Climate shaped the worldwide distribution of human mitochondrial DNA sequence variation
Abstract
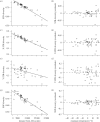
There is an ongoing discussion in the literature on whether human mitochondrial DNA (mtDNA) evolves neutrally. There have been previous claims for natural selection on human mtDNA based on an excess of non-synonymous mutations and higher evolutionary persistence of specific mitochondrial mutations in Arctic populations. However, these findings were not supported by the reanalysis of larger datasets. Using a geographical framework, we perform the first direct test of the relative extent to which climate and past demography have shaped the current spatial distribution of mtDNA sequences worldwide. We show that populations living in colder environments have lower mitochondrial diversity and that the genetic differentiation between pairs of populations correlates with difference in temperature. These associations were unique to mtDNA; we could not find a similar pattern in any other genetic marker. We were able to identify two correlated non-synonymous point mutations in the ND3 and ATP6 genes characterized by a clear association with temperature, which appear to be plausible targets of natural selection producing the association with climate. The same mutations have been previously shown to be associated with variation in mitochondrial pH and calcium dynamics. Our results indicate that natural selection mediated by climate has contributed to shape the current distribution of mtDNA sequences in humans.
Figures


References
-
- Amo T., Brand M. D.2007Were inefficient mitochondrial haplogroups selected during migrations of modern humans? A test using modular kinetic analysis of coupling in mitochondria from cybrid cell lines. Biochem. J. 404, 345–351 (doi:10.1042/BJ20061609) - DOI - PMC - PubMed
-
- Ballard J. W. O., Whitlock M. C.2004The incomplete natural history of mitochondria. Mol. Ecol. 13, 729–744 (doi:10.1046/j.1365-294X.2003.02063.x) - DOI - PubMed
-
- Betti L., Balloux F., Amos W., Hanihara T., Manica A.2009Distance from Africa, not climate, explains within-population phenotypic diversity in humans. Proc. R. Soc. B 276, 809–814 (doi:10.1098/rspb.2008.1563) - DOI - PMC - PubMed
-
- Brand M. D.1990The proton leak across the mitochondrial inner membrane. Biochim. Biophys. Acta 1018, 128–133 (doi:10.1016/0005-2728(90)90232-S) - DOI - PubMed
-
- Canter J. A., Kallianpur A. R., Parl F. F., Millikan R. C.2005Mitochondrial DNA G10398A polymorphism and invasive breast cancer in African-American women. Cancer Res. 65, 8028–8033 - PubMed
Publication types
MeSH terms
Substances
Grants and funding
LinkOut - more resources
Full Text Sources
Miscellaneous
