. 2009 Oct;83(19):9786-802.
doi: 10.1128/JVI.00704-09. Epub 2009 Jul 8.

Disruption of LANA in rhesus rhadinovirus generates a highly lytic recombinant virus

Affiliations

Disruption of LANA in rhesus rhadinovirus generates a highly lytic recombinant virus

Kwun Wah Wen et al. J Virol. 2009 Oct.

Abstract

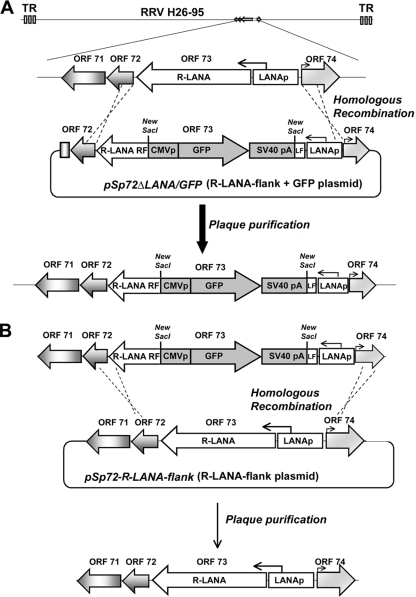
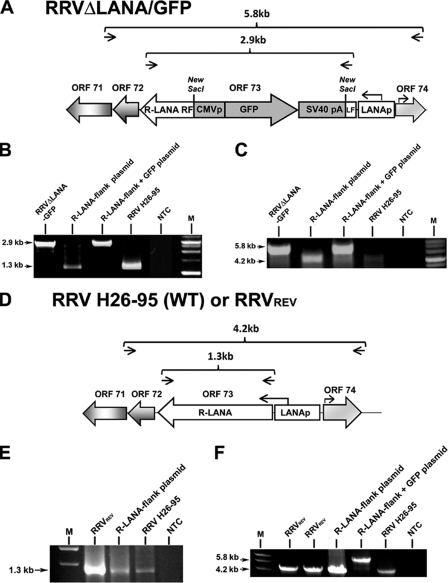
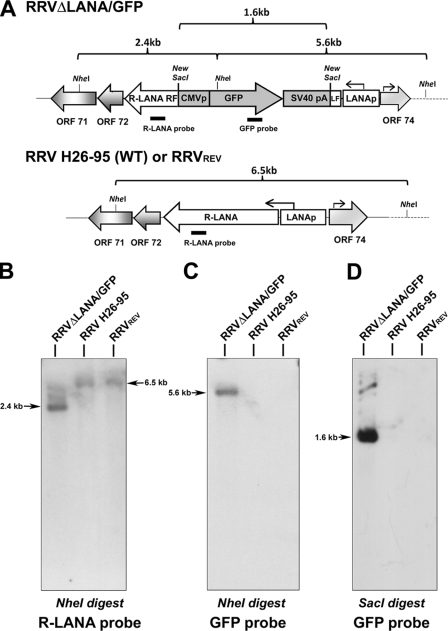
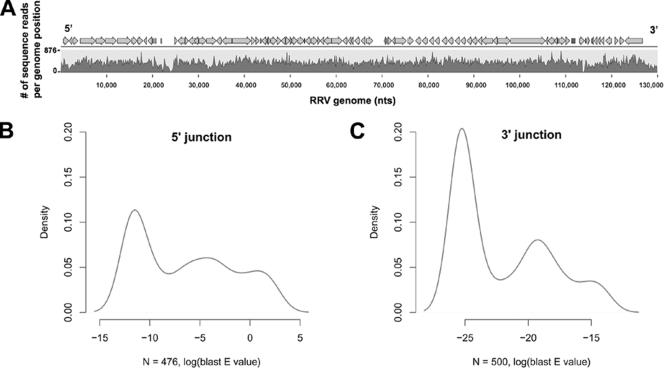
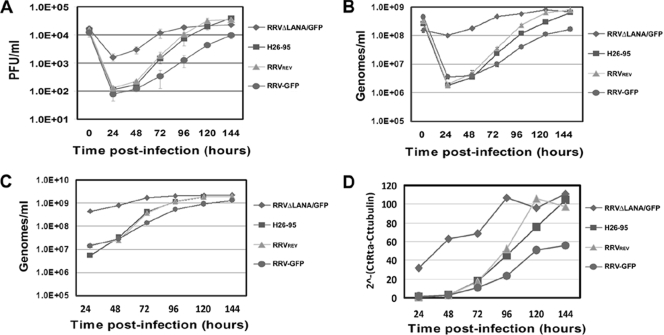
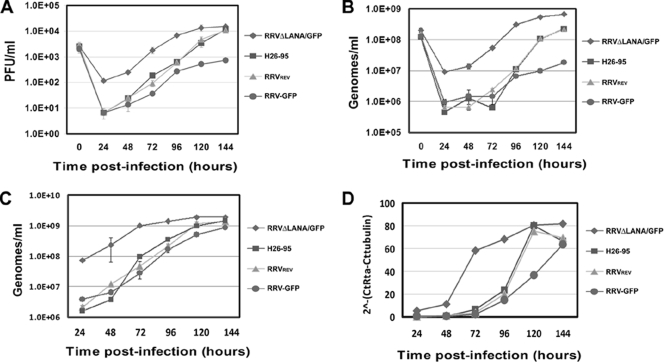
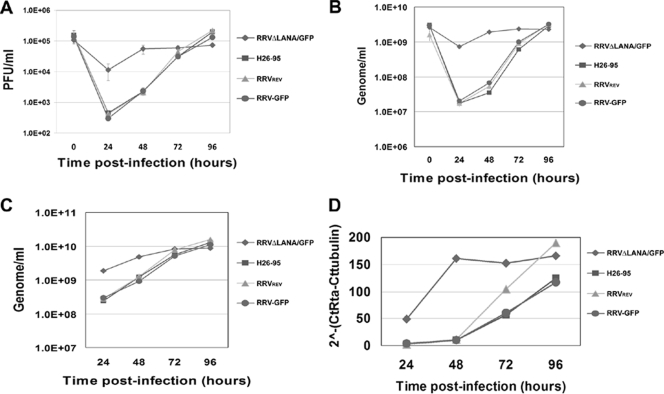
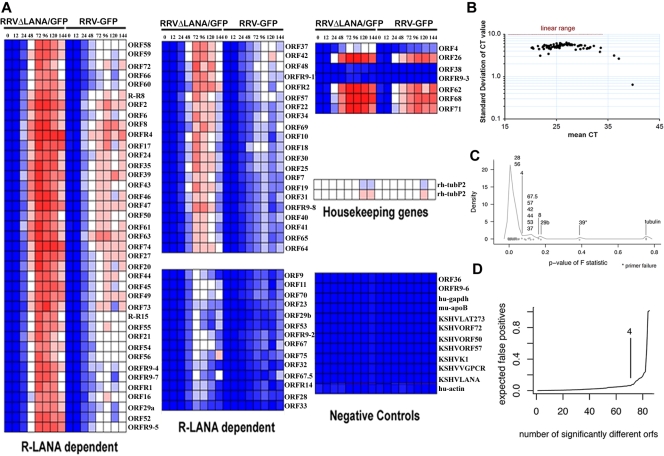
Rhesus monkey rhadinovirus (RRV) is a gammaherpesvirus that is closely related to human Kaposi's sarcoma-associated herpesvirus (KSHV/HHV-8). RRV is the closest relative to KSHV that has a fully sequenced genome and serves as an in vitro and an in vivo model system for KSHV. The latency-associated nuclear antigen (LANA) protein of both KSHV and RRV plays key roles in the establishment and maintenance of these herpesviruses. We have constructed a RRV recombinant virus (RRVDeltaLANA/GFP) in which the RRV LANA open reading frame has been disrupted with a green fluorescent protein (GFP) expression cassette generated by homologous recombination. The integrity of the recombinant virus was confirmed by diagnostic PCR, restriction digestion, Southern blot analysis, and whole-genome sequencing. We compared the single-step and multistep replication kinetics of RRVDeltaLANA/GFP, RRV-GFP, wild-type (WT) RRV H26-95, and a revertant virus using traditional plaque assays, as well as real-time quantitative PCR-based genome quantification assays. The RRVDeltaLANA/GFP recombinant virus exhibited significantly higher lytic replicative properties compared to RRV-GFP, WT RRV, or the revertant virus. This was observed upon de novo infection and in the absence of chemical inducers such as phorbol esters. In addition, by using a quantitative real-time PCR-based viral array, we are the first to report differences in global viral gene expression between WT and recombinant viruses. The RRVDeltaLANA/GFP virus displayed increased lytic gene transcription at all time points postinfection compared to RRV-GFP. Moreover, we also examined several cellular genes that are known to be repressed by KSHV LANA and report that these genes are derepressed during de novo lytic infection with the RRVDeltaLANA/GFP virus compared to RRV-GFP. Finally, we also demonstrate that the RRVDeltaLANA/GFP virus fails to establish latency in B cells, as measured by the loss of GFP-positive cells and intracellular viral genomes.


Figures

FIG. 1.
FIG. 1.
Schematic representation of the construction of the RRVΔLANA/GFP and RRVREV recombinant viruses. (A) Construction of the RRVΔLANA/GFP virus. An EGFP expression cassette driven by a CMV promoter was inserted into the N terminus of R-LANA (Orf73) to disrupt the R-LANA ORF. This EGFP cassette was cloned into a plasmid containing the coding sequence of R-LANA and flanking ORFs (Orf71 to Orf74). The plasmid (pSp72ΔLANA/GFP) was linearized and transfected into RhF and then subjected to RRV infection at a low MOI. Single GFP-expressing viral plaques were purified for five rounds, and one such isolate, designated RRVΔLANA/GFP, was chosen for further study. (B) Construction of a revertant RRVREV virus. A plasmid containing the coding sequence of R-LANA flanked by Orf71 and Orf74 (pSp72-R-LANA-flank) was linearized and transfected into RhF. Transfected cells were infected with RRVΔLANA/GFP at a low MOI. GFP-negative viral plaques were purified. One such isolate was designated RRVREV and chosen for further study. LF, left flank; RF, right flank.
FIG. 2.
FIG. 2.
PCR analysis of recombinant viruses. (A) Schematic representation of PCR diagnosis of RRVΔLANA/GFP virus. Primers (arrows) for either the full-length R-LANA ORF (lower bracket) or the R-LANA flanking ORF (upper bracket). (B) Templates used in the PCRs are labeled on top of each lane. NTC denotes nontemplate control, and M denotes marker. With the R-LANA primer set, the expected size for R-LANA (∼1,350 bp) was seen in R-LANA-flank plasmid (i.e., pSp72-R-LANA-flank plasmid in Fig. 1B) and RRV H26-95 viral DNA. The RRVΔLANA/GFP lane and R-LANA-flank+GFP (i.e., pSp72ΔLANA/GFP in Fig. 1A) plasmid lane show the expected size (∼2,950 bp) for EGFP cassette (∼1,600 bp) insertion. (C) with the R-LANA flanking primer set, an expected size of ∼4,200 bp was seen with the R-LANA-flank plasmid and RRV H26-95 viral DNA. The RRVΔLANA/GFP lane and R-LANA-flank+GFP plasmid lane show the expected size (∼5,800 bp) for EGFP cassette insertion. (D) A schematic representation of PCR diagnosis of RRVREV. Primers (arrows) for either the full-length R-LANA ORF (lower bracket) or the R-LANA flanking ORF (upper bracket). (E) with the full-length R-LANA primer set, the PCR product of RRVREV shows the correct size for R-LANA ORF, similar to the amplicon size (∼1,350 bp) of positive template controls (R-LANA-flank plasmid and RRV H26-95 viral DNA). (F) PCR using the R-LANA flank primer set displays an expected amplicon size (∼4,200 bp) for the RRVREV template as indicated by the same amplified fragment size when WT R-LANA-flank plasmid or viral DNA H26-95 was used as the template.
FIG. 3.
FIG. 3.
Restriction digest and Southern blot analysis of recombinant viruses. (A) A schematic illustration showing the strategy for NheI or SacI restriction enzyme digestion and Southern blot analysis of RRVΔLANA/GFP, WT H26-95, and RRVREV genomic DNA. R-LANA probe was generated from digestion of a plasmid encoding R-LANA, and the GFP probe was generated from a PCR product of the pEGFP-N1 plasmid. (B) The R-LANA probe hybridized to a 2.4-kb fragment in RRVΔLANA/GFP digested with NheI, and a 6.5-kb fragment in RRV H26-95 and RRVREV digested with NheI. (C) The GFP probe hybridized to a 5.6-kb fragment of NheI-digested RRVΔLANA/GFP genomic DNA. The GFP probe did not hybridize to the WT H26-95 or RRVREV DNA, as expected. (D) Restriction digestion with SacI released a 1.6-kb fragment corresponding to the size of the exogenous GFP sequence from RRVΔLANA/GFP genomic DNA, but no fragment was detected in the WT or revertant viral DNA.
FIG. 4.
FIG. 4.
Illumina/Solexa whole viral genome sequencing. (A) Coverage of RRVΔLANA/GFP genome by Solexa sequencing reads. Solexa generates 35-bp DNA reads. These were aligned to the RRV H26-95 genome using the reference sequence. The arrows on top represent individual RRV ORFs and the numbers represent nucleotide coordinates. The graph below shows the number of reads at each nucleotide position on a linear scale from 0 to 876. Peaks indicate regions of high coverage, valleys indicate regions of low coverage. Complete coverage of the whole RRV H26-95 genome was achieved. Maximum coverage was 876-fold. (B) Correct insertion of the GFP cassette into the R-LANA ORF was verified by comparing all Solexa fragments with the predicted RRV LANA-GFP junctional sequence. We found 476 Solexa reads that matched the 5′ LANA-GFP junctional sequence. Shown is the distribution (density) of BLAST scores log(blast E value) for this comparison. Lower values (i.e., those less than −10) indicate sequence reads that matched the junction sequence perfectly, without any gap or even a single mismatch. (C) We found 500 Solexa reads that matched the 5′ LANA-GFP junctional sequence. Shown is the distribution (density) of BLAST scores log(blast E value) for this comparison. Again, the majority of reads matched perfectly [lowest log(blast E value)]. If there was an inadvertent single nucleotide insertion at this site, we would expect the majority (i.e., the peak of the density distribution) not to be associated with the lowest log(blast E value) but with a higher one, indicative of a mismatch.
FIG. 5.
FIG. 5.
Viral growth curves of RRVΔLANA/GFP in rhesus fibroblasts at an MOI of 0.5. Equivalent numbers of RhF cells were infected with RRVΔLANA/GFP, WT H26-95, RRVREV, or RRV-GFP at an MOI of 0.5. Cell-free supernatants and cell pellets were harvested at indicated points postinfection. (A) Infectious virus particles from supernatants were quantitated by traditional plaque assay. (B) Extracellular viral genomes from the same samples as in panel A were quantitated by real-time PCR assay. In this real-time PCR-based assay, a RRV Orf50/Rta copy number standard curve was used to generate the viral genome copy number. (C) Intracellular viral genomes extracted from infected cell pellets were quantitated by real-time PCR using a RRV Orf50 standard curve to generate the viral genome copy number. (D) The viral genomes were normalized to rhesus β-tubulin copy numbers. The same samples as in panel C were subjected to real-time PCR with RRV Orf50 primers as described in panel C, and rhesus β-tubulin primers to absolutely quantitate rhesus β-tubulin copy numbers using a rhesus β-tubulin standard curve. During real-time QPCR, the amount of product at each cycle is quantified, and the CT at which the product signal crossed a user-defined threshold is recorded. In this figure, dCT is mathematically defined as CT(Rta)CT(tubulin), the signal difference between the viral gene Orf50 and the cellular gene rhesus β-tubulin in a sample. The y axis (2CT(Rta) − CT(tubulin)) thus reflects the fold difference, or relative abundance, of RRV viral genomes compared to the cellular genomes. In all panels, results are the averages of duplicate or triplicate samples. Error bars represent the standard deviations.
FIG. 6.
FIG. 6.
Viral growth curves of RRVΔLANA/GFP in rhesus fibroblasts at an MOI of 0.1. Equivalent numbers of RhF cells were infected with RRVΔLANA/GFP, WT H26-95, RRVREV, or RRV-GFP at an MOI of 0.1. Cell-free supernatants and the cell pellet were harvested at the indicated time points postinfection. (A) Infectious virus particles from supernatants were quantitated by traditional plaque assay. (B) Extracellular viral genomes from the same samples as in panel A were quantitated by real-time PCR assay. In this real-time PCR-based assay, a RRV Orf50 copy number standard curve was used to generate the viral genome copy number. (C) Intracellular viral genomes extracted from infected cell pellets were quantitated by real-time PCR using a RRV Orf50 standard curve to generate the viral genome copy number. (D) The viral genomes were normalized to rhesus β-tubulin copy numbers. The same samples as in panel C were subjected to real-time PCR with RRV Orf50 primers, as described in panel C, and rhesus β-tubulin primers to absolutely quantitate the rhesus β-tubulin copy numbers using a rhesus β-tubulin standard curve. In all of the panels, the results are the averages of duplicate or triplicate samples. Error bars represent the standard deviations.
FIG. 7.
FIG. 7.
Viral growth curves of RRVΔLANA/GFP in rhesus fibroblasts at an MOI of 5. Equivalent numbers of RhF cells were infected with RRVΔLANA/GFP, WT H26-95, RRVREV, or RRV-GFP at an MOI of 5. Cell-free supernatants and cell pellet were harvested at indicated points postinfection. (A) Infectious virus particles from supernatants were quantitated by traditional plaque assay. (B) Extracellular viral genomes from the same samples as in panel A were quantitated by real-time PCR assay. In this real-time PCR-based assay, a RRV Orf50 copy number standard curve was used to generate the viral genome copy number. (C) Intracellular viral genomes extracted from infected cell pellets were quantitated by real-time PCR using a RRV Orf50 standard curve to generate the viral genome copy number. (D) The viral genomes were normalized to rhesus β-tubulin copy numbers. The same samples as in panel C were subjected to real-time PCR with RRV Orf50 primers, as described in panel C, and rhesus β-tubulin primers to absolutely quantitate rhesus β-tubulin copy numbers using a rhesus β-tubulin standard curve. In all of the panels, the results are the averages of duplicate or triplicate samples. Error bars represent the standard deviations.
FIG. 8.
FIG. 8.
Viral gene profiling of RRVΔLANA/GFP and RRV-GFP-infected rhesus fibroblasts. (A) Heat map representation of real-time QPCR data normalized to rhesus tubulin (dCT) of infected cells obtained at 0, 12, 24, 48, 72, 96, 120, and 144 h postinfection. The dCT values were hierarchically clustered by using standard Euclidian correlation method. Blue indicates low, white represents intermediate/median, and red represents the highest level of viral mRNA detected relative to rhesus tubulin. (See Fig. S3 in the supplemental material for a high-resolution image.) (B) Quality control of RRV QPCR primers for all of the ORFs. There was no significant correlation between the magnitude of the log(SD) and the mean CT, demonstrating that, except for three outliers, changes in RRV gene expression did not depend on the overall levels of any particular viral mRNA. (C) Distribution of RRV ORFs showing differential transcript abundance between samples. We determined for each individual gene in the array whether its relative abundance at each time point differed between the WT and the mutant. The significance of the difference is expressed by the P value of the F statistic. mRNAs that differed significantly in their transcription pattern yield a low P value. We then plotted the density, i.e., the distribution of P values for all mRNAs in the array. Individual dots just above the x axis indicate individual mRNAs. The peak at a low P value indicates that the majority of mRNAs have differential expression between the WT RRV-GFP and mutant RRVΔLANA/GFP viruses. Orf4 has a P value of 0.076 and is a watershed to differentiate ORFs that exhibit statistically significant differences (peak group left to Orf4) from those that do not (right to Orf4). Orf28 and Orf56 are the only genes within the peak group with a P of >0.05. (D) A great concern in array analysis is the problem of multiple comparisons. Given enough comparisons; one would expect some ORFs to show a statistically significant difference by chance alone. These are called false positives. The expected number of false positives (i.e., the rate) can be calculated based on the total number of genes in the array and the P values of the individual comparisons. Shown in this panel is a plot of the expected rate of false positives against the number of RRV ORFs considered showing individually statistically significant differences in mRNA levels between WT and mutant viruses. Based on the P value distribution in panel C, one would expect less than 1 (<0.02) false positive within the top 71 differentially regulated genes, i.e., those that differed more significantly between the WT and mutant than Orf4 (indicated in panel D).
FIG. 9.
FIG. 9.
RRVΔLANA/GFP and RRV-GFP infection of B lymphocytes. The KSHV-negative PEL cell line, BJAB, was infected with RRVΔLANA/GFP or RRV-GFP virus at an MOI of 0.5 by spinoculation. At 7 days postinfection, infected BJAB cells were sorted by flow cytometry for the presence of green fluorescence. (A) Flow cytometry analysis of GFP-positive BJAB cells infected with RRVΔLANA/GFP or RRV-GFP virus immediately after sorting (day 0 postsorting) and 14 days postsorting. The percentages of GFP-positive cells at the indicated time points are shown below the graphs. (B) Representative images of RRVΔLANA/GFP and RRV-GFP-infected BJAB cells on day 14 postsorting. Bright-field and GFP fluorescence images of RRV-infected GFP-positive B cells are shown. (C) Intracellular viral genomes of RRVΔLANA/GFP (▪)- and RRV-GFP (□)-infected BJAB cells on day 7 and day 14 postsorting. Intracellular genomes extracted from infected cell pellets were quantitated by real-time PCR using a RRV Orf50 standard curve to generate the viral genome copy number. The viral genomes were normalized to human GAPDH copy numbers, which were generated by using a human GAPDH standard curve. The results are the averages of triplicate samples. Error bars represent the standard deviations.

Similar articles

Cited by

References

    1. Alexander, L., L. Denekamp, A. Knapp, M. R. Auerbach, B. Damania, and R. C. Desrosiers. 2000. The primary sequence of rhesus monkey rhadinovirus isolate 26-95: sequence similarities to Kaposi's sarcoma-associated herpesvirus and rhesus monkey rhadinovirus isolate 17577. J. Virol. 74:3388-3398. - PMC - PubMed
    1. An, F. Q., N. Compitello, E. Horwitz, M. Sramkoski, E. S. Knudsen, and R. Renne. 2005. The latency-associated nuclear antigen of Kaposi's sarcoma-associated herpesvirus modulates cellular gene expression and protects lymphoid cells from p16 INK4A-induced cell cycle arrest. J. Biol. Chem. 280:3862-3874. - PubMed
    1. An, J., Y. Sun, and M. B. Rettig. 2004. Transcriptional coactivation of c-Jun by the KSHV-encoded LANA. Blood 103:222-228. - PubMed
    1. Bajaj, B. G., S. C. Verma, K. Lan, M. A. Cotter, Z. L. Woodman, and E. S. Robertson. 2006. KSHV encoded LANA upregulates Pim-1 and is a substrate for its kinase activity. Virology 351:18-28. - PubMed
    1. Ballestas, M. E., P. A. Chatis, and K. M. Kaye. 1999. Efficient persistence of extrachromosomal KSHV DNA mediated by latency-associated nuclear antigen. Science 284:641-644. - PubMed

Publication types

LinkOut - more resources