. 2009 Sep;83(18):9057-67.
doi: 10.1128/JVI.01055-09. Epub 2009 Jul 8.

Role for the paramyxovirus genomic promoter in limiting host cell antiviral responses and cell killing

Affiliations

Role for the paramyxovirus genomic promoter in limiting host cell antiviral responses and cell killing

Mary J Manuse et al. J Virol. 2009 Sep.

Abstract

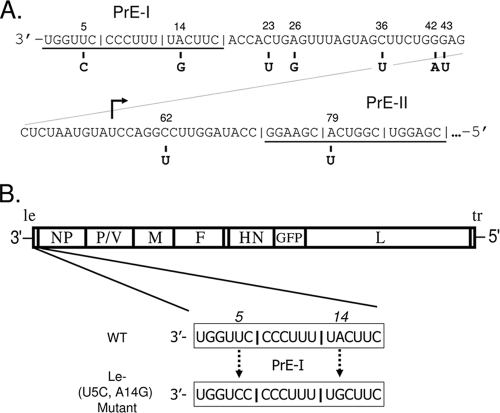
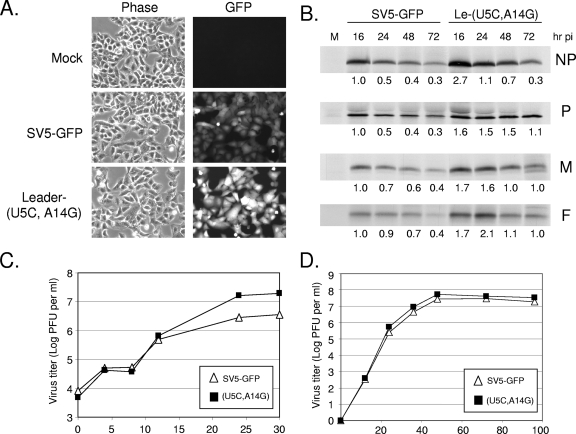
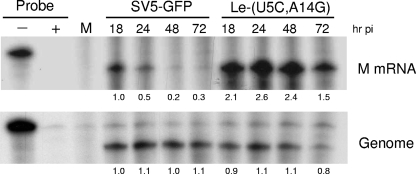
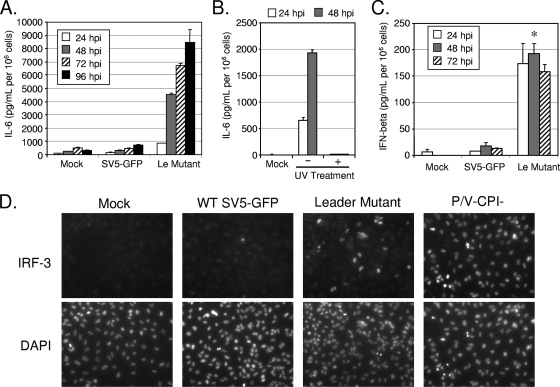
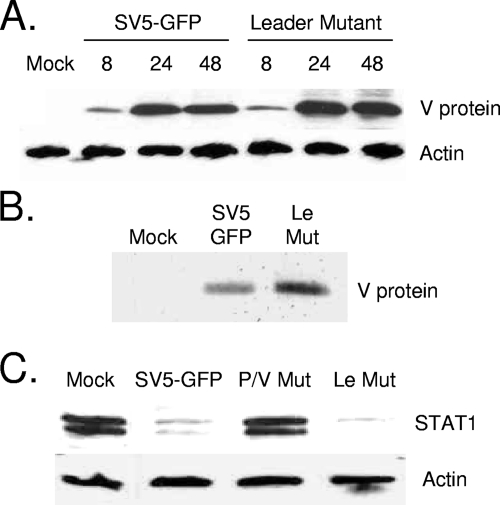
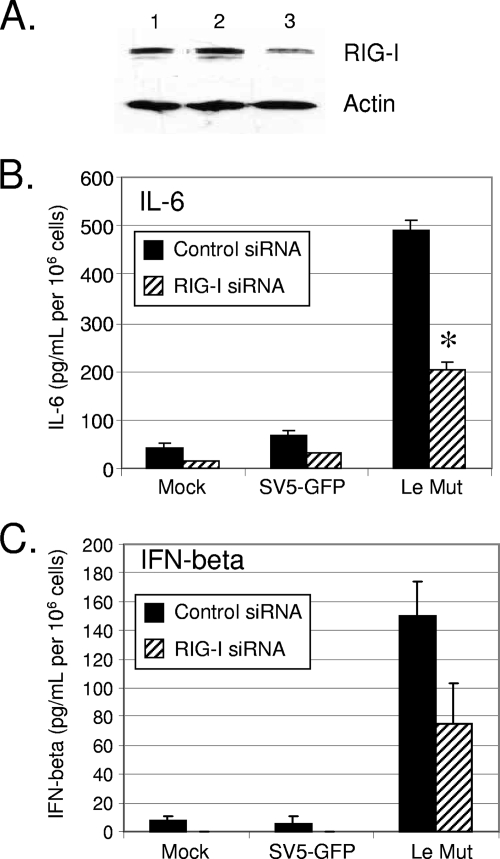
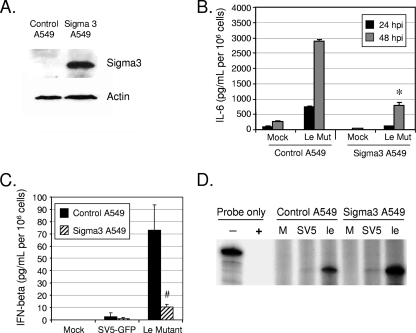
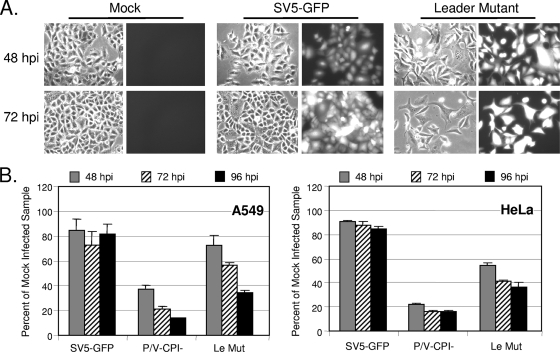
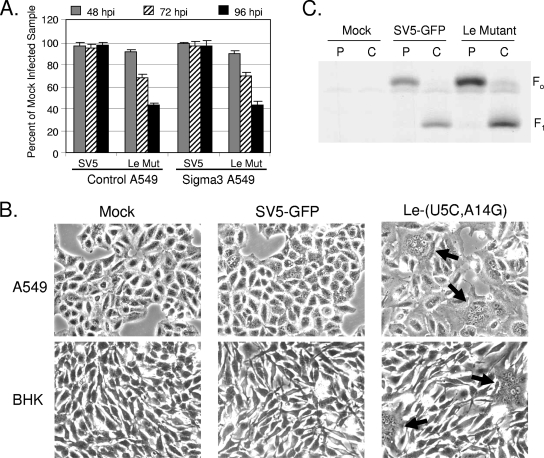
The parainfluenza virus simian virus 5 (SV5) is a poor inducer of innate immune responses. In contrast, the naturally occurring SV5 variant Wake Forest parainfluenza virus (WF-PIV) activates the synthesis of proinflammatory cytokines and beta interferon (IFN-beta). Comparison of SV5 and WF-PIV genome sequences revealed nine nucleotide differences within the viral genomic promoter, including two substitutions (U5C and A14G) in the most highly conserved 3'-end promoter element. To test the consequences of these promoter variations, a recombinant SV5 mutant [Le-(U5C, A14G)] was engineered to harbor the two WF-PIV genomic promoter substitutions in an otherwise wild-type (WT) SV5 background. Human lung epithelial cells infected with the Le-(U5C, A14G) mutant had higher rates of viral protein synthesis and levels of mRNA than cells infected with WT SV5, but levels of genomic RNA were not changed. Unlike WT SV5, the Le-(U5C, A14G) mutant was a potent inducer of interleukin-6 and IFN-beta synthesis, despite expressing a functional V protein antagonist. Cytokine responses to Le-(U5C, A14G) infection were reduced either by small interfering RNA-mediated knockdown of retinoic acid-inducible gene I (RIG-I) or after infection of cells that were engineered to express the reovirus sigma3 double-stranded RNA-binding protein. Le-(U5C, A14G) induced cytopathic effects not seen with WT SV5, and the extent of cell killing correlated with elevated levels of viral F protein and cell-cell fusion. Our results support a model whereby the SV5 promoter has evolved to function at an attenuated level in order to limit (i) synthesis of aberrant RNAs which induce RIG-I-mediated responses and (ii) overproduction of mRNA for potentially toxic gene products, such as the F protein. Control of genomic promoter activity may be particularly important for viruses such as SV5, that express a V protein targeting mda-5 but do not encode antagonists such as the paramyxovirus C proteins, that specifically target RIG-I.


Figures

FIG. 1.
FIG. 1.
Schematic diagram of SV5 genomic promoter and viruses used in this study. (A) Genomic promoter. The 3′-to-5′ sequence of the 90-base SV5 genomic promoter is shown, with the positions of nucleotides that differ between WT SV5 (top) and the WF-PIV variant of SV5 (bottom). The three hexamers that compose PrE-I and PrE-II are denoted by underlining, and the start site for transcription of the NP gene is shown by an arrow. (B) The genome structure of SV5 is shown, with the addition of the GFP gene between HN and L, as described previously (16). The sequences at positions 5 and 14 in the PrE-I region that differ between WT SV5-GFP and the Le-(U5C, A14G) mutant are indicated. le, leader; tr, trailer.
FIG. 2.
FIG. 2.
The Le-(U5C, A14G) mutant overexpresses viral protein compared to WT SV5. (A) Microscopy. A549 cells were mock infected or infected at an MOI of 10 with SV5-GFP or the Le-(U5C, A14G) mutant. Cells were examined by microscopy at 24 h p.i. (B) Rate of viral protein synthesis. A549 cells were mock infected (lane M) or infected at an MOI of 10 with SV5-GFP or the Le-(U5C, A14G) mutant. At the indicated times p.i., cells were radiolabeled for 20 min with Tran[35S]-label. Cells were lysed, and equal amounts of protein were immunoprecipitated with antibodies to the indicated proteins before analysis by SDS-polyacrylamide gel electrophoresis and autoradiography. Numbers beneath the autoradiograms indicate the expression levels relative to those for WT-infected cells at 16 h p.i. (C and D) Virus growth kinetics. A549 cells were infected at an MOI of 10 (C) or 0.05 (D), and virus in the media at the indicated times p.i. was quantitated by plaque assay. Data are representative of three independent experiments.
FIG. 3.
FIG. 3.
Accumulation of Le-(U5C, A14G) mutant mRNA and genomic RNA. A549 cells were mock infected (lane M) or infected at an MOI of 10 with SV5-GFP or the Le-(U5C, A14G) mutant. At the indicated times p.i., RNA was harvested as described in Materials and Methods and analyzed by an RPA using 32P-labeled riboprobes specific for M mRNA or the leader-NP junction for genomic RNA. − and + indicate control samples where riboprobe alone was incubated without or with nuclease, respectively. The − lanes represent 1/50 of the input probe for each sample. The number for each lane indicates the change in signal (n-fold) relative to the level at 18 h p.i., with the level for SV5-GFP set at 1.0.
FIG. 4.
FIG. 4.
Induction of proinflammatory cytokines and IFN by the Le-(U5C, A14G) mutant but not by WT SV5. (A, B, and C) Induction of cytokines. A549 cells were mock infected or infected at an MOI of 10 with SV5-GFP or the Le-(U5C, A14G) mutant, and at the indicated times p.i., levels of secreted IL-6 (A and B) or IFN-β (C) were determined by ELISA. Results are the expressed as mean values from triplicate samples, with error bars representing standard deviations, and are normalized to the level for 106 cells. *, P value of <0.005 compared to corresponding samples from control cells. For panel B, the Le-(U5C, A14G) mutant virus was treated with (+) or without (−) UV light prior to infection. (D) IRF-3 nuclear translocation. A549 cells were infected at an MOI of 10 with the indicated viruses. At 24 h p.i., cells were stained for IRF-3 using a monoclonal antibody and for the nucleus using DAPI (4′,6-diamidino-2-phenylindole).
FIG. 5.
FIG. 5.
The Le-(U5C, A14G) mutant (Mut) encodes a functional V protein. (A) Time course of V protein expression. A549 cells were infected at a high MOI, and at the indicated times p.i., cell lysates were analyzed by Western blotting for levels of V protein and cellular actin. (B) Cells infected with the indicated viruses were labeled at 24 h p.i. for 30 min with [35S]cysteine before immunoprecipitation with anti-V protein antibody. (C) STAT1 levels. A549 cells were infected at an MOI of 10 with the indicated viruses. Cell lysates were prepared at 8 h p.i., and levels of STAT1 and actin were determined by Western blotting.
FIG. 6.
FIG. 6.
Role of RIG-I in cytokine induction by the Le-(U5C, A14G) mutant (Mut). (A) RIG-I knockdown. A549 cells were left untreated (lane 1) or transfected with control siRNA (lane 2) or siRNA targeting RIG-I (lane 3). Forty-eight hours posttransfection, levels of RIG-I and actin were assayed by Western blotting. (B and C) Cytokine secretion. A549 cells were transfected with control siRNA or siRNA specific for RIG-I. At 48 h posttransfection, cells were mock infected or infected at an MOI of 10 with SV5-GFP or the Le-(U5C, A14G) mutant, and levels of secreted IL-6 (B) or IFN-β (C) were measured by ELISA at 24 h p.i. Results are expressed as mean values from triplicate samples, with error bars representing standard deviations, and are normalized to the level for 106 cells. *, P value of <0.005 compared to corresponding samples from control cells.
FIG. 7.
FIG. 7.
Role of dsRNA in cytokine induction by the Le-(U5C, A14G) mutant (Mut). (A) A549 cells expressing reovirus sigma3 protein. Control A549 cells or cells that stably express the reovirus sigma3 protein were analyzed by Western blotting for levels of sigma3. (B and C) Cytokine secretion. Control or sigma3-expressing A549 cells were mock infected or infected at an MOI of 10 with the Le-(U5C, A14G) mutant, and levels of secreted IL-6 were measured by ELISA at the indicated times p.i. For panel C, IFN-β levels were determined at 24 h p.i. Results are expressed as mean values from triplicate samples, with error bars representing standard deviations. * and #, P values of <0.005 and <0.05, respectively, compared to corresponding samples from control cells. (D) Viral M mRNA levels in sigma3-expressing cells. Control or sigma3-expressing A549 cells were mock infected or infected at an MOI of 10 with the indicated viruses. RNA harvested at 48 h p.i. was analyzed by an RPA with a probe specific for M mRNA. − and + indicate control samples where riboprobe alone was incubated without or with nuclease, respectively. The − lane represents 1/50 of the input probe for each sample. M, mock; SV5, SV5-GFP; le, Le-(U5C, A14G) mutant.
FIG. 8.
FIG. 8.
Cytopathic effect induced by the Le-(U5C, A14G) mutant (Mut) but not WT SV5-GFP. (A) A549 cells were infected at an MOI of 10 with SV5-GFP or the Le-(U5C, A14G) mutant, and microscopy pictures were taken at 48 and 72 h p.i. (B) Cell viability. A549 or HeLa cells were mock infected or infected with the indicated viruses at an MOI of 10. Cell viability was determined at 48, 72, and 96 h p.i. using a cell viability assay. Data are from quadruplicate samples and are expressed as percentages of the values obtained with mock-infected cells. Error bars represent the standard deviations.
FIG. 9.
FIG. 9.
The Le-(U5C, A14G) mutant (Mut) induces cytopathic effects that correlate with increased levels of F protein and cell-cell fusion. (A) Cell viability. Control or sigma3-expressing A549 cells were mock infected or infected with the indicated viruses at an MOI of 10. Cell viability was determined at 48, 72, and 96 h p.i. using a cell viability assay as described in the legend for Fig. 8. Error bars represent the standard deviations. (B) Microscopy pictures. A549 or BHK cells were mock infected or infected with the indicated viruses at an MOI of 10. Microscopy pictures were taken at 48 h p.i. Arrows indicate syncytium pockets. (C) Rate of F protein expression and cleavage. A549 cells that were mock infected or infected with the indicated viruses were pulse-labeled for 20 min with Tran[35S]-label. Cells were either lysed immediately (pulse lanes, P) or lysed after incubation for 3 h in nonradioactive media (chase lanes, C), immunoprecipitated with anti-F antiserum, and analyzed by SDS-polyacrylamide gel electrophoresis and autoradiography.

Similar articles

Cited by

References

    1. Andrejeva, J., K. S. Childs, D. F. Young, R. S. Carlos, N. Stock, S. Goodbourn, and R. E. Randall. 2004. The V proteins of paramyxoviruses bind the IFN-inducible RNA helicase, mda-5, and inhibit its activation of the IFN-beta promoter. Proc. Natl. Acad. Sci. USA 101:17264-17269. - PMC - PubMed
    1. Biron, C. A., and G. C. Sen. 2007. Innate responses to viral infections, p. 249-278. In D. M. Knipe, P. M. Howley, D. E. Griffin, R. A. Lamb, M. A. Martin, B. Roizman, and S. E. Straus (ed.), Fields virology, 5th ed. Lippincott Williams & Wilkins, Philadelphia, PA.
    1. Bitko, V., A. Musiyenko, M. A. Bayfield, R. J. Maraia, and S. Barik. 2008. Cellular La protein shields nonsegmented negative-strand RNA viral leader RNA from RIG-I and enhances virus growth by diverse mechanisms. J. Virol. 82:7977-7987. - PMC - PubMed
    1. Childs, K. S., N. Stock, C. Ross, J. Andrejeva, L. Hilton, M. Skinner, R. Randall, and S. Goodbourn. 2007. mda-5, but not RIG-I, is a common target for paramyxovirus V proteins. Virology 359:190-200. - PubMed
    1. Childs, K. S., J. Andrejeva, R. E. Randall, and S. Goodbourn. 2009. Mechanism of mda-5 inhibition by paramyxovirus V proteins. J. Virol. 83:1465-1473. - PMC - PubMed

Publication types

LinkOut - more resources