. 2009 Sep;83(18):9474-85.
doi: 10.1128/JVI.01089-09. Epub 2009 Jul 8.

Defining APOBEC3 expression patterns in human tissues and hematopoietic cell subsets

Affiliations

Defining APOBEC3 expression patterns in human tissues and hematopoietic cell subsets

Fransje A Koning et al. J Virol. 2009 Sep.

Abstract

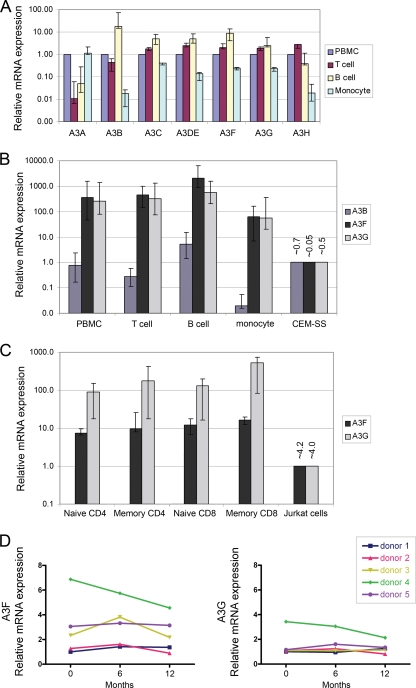
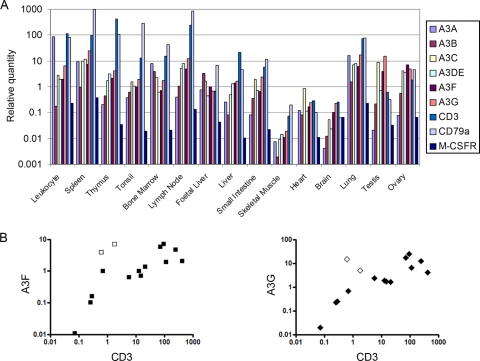
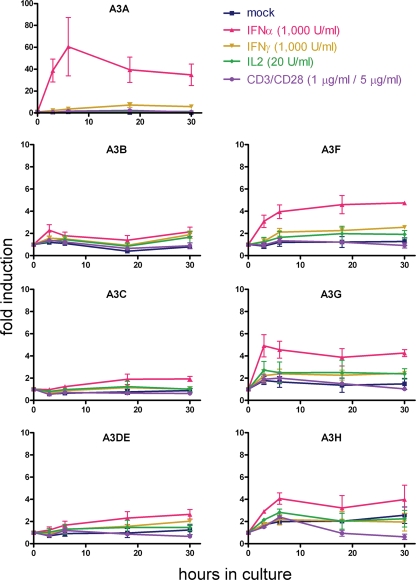
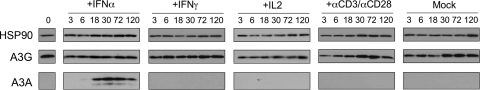
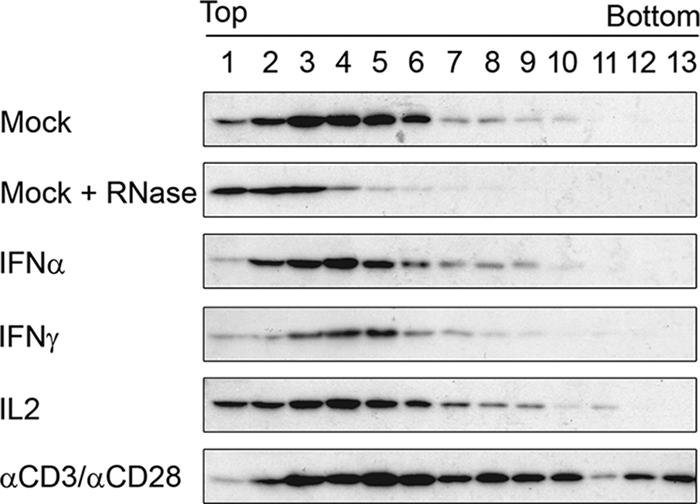
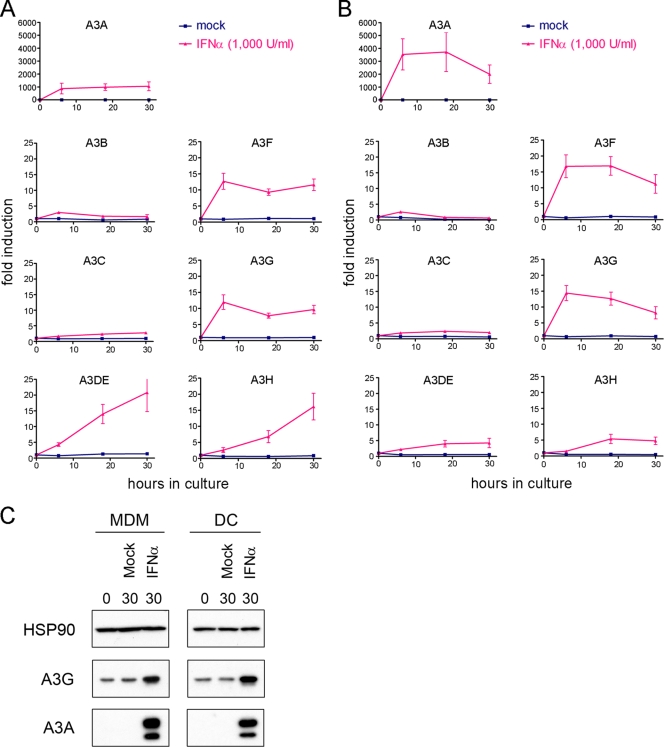
Human APOBEC3 enzymes are cellular DNA cytidine deaminases that inhibit and/or mutate a variety of retroviruses, retrotransposons, and DNA viruses. Here, we report a detailed examination of human APOBEC3 gene expression, focusing on APOBEC3G (A3G) and APOBEC3F (A3F), which are potent inhibitors of human immunodeficiency virus type 1 (HIV-1) infection but are suppressed by HIV-1 Vif. A3G and A3F are expressed widely in hematopoietic cell populations, including T cells, B cells, and myeloid cells, as well as in tissues where mRNA levels broadly correlate with the lymphoid cell content (gonadal tissues are exceptions). By measuring mRNA copy numbers, we find that A3G mRNA is approximately 10-fold more abundant than A3F mRNA, implying that A3G is the more significant anti-HIV-1 factor in vivo. A3G and A3F levels also vary between donors, and these differences are sustained over 12 months. Responses to T-cell activation or cytokines reveal that A3G and A3F mRNA levels are induced approximately 10-fold in macrophages and dendritic cells (DCs) by alpha interferon (IFN-alpha) and approximately 4-fold in naïve CD4(+) T cells. However, immunoblotting revealed that A3G protein levels are induced by IFN-alpha in macrophages and DCs but not in T cells. In contrast, T-cell activation and IFN-gamma had a minimal impact on A3G or A3F expression. Finally, we noted that A3A mRNA expression and protein expression are exquisitely sensitive to IFN-alpha induction in CD4(+) T cells, macrophages, and DCs but not to T-cell activation or other cytokines. Given that A3A does not affect HIV-1 infection, these observations imply that this protein may participate in early antiviral innate immune responses.


Figures

FIG. 1.
FIG. 1.
Expression of APOBEC3 mRNA in PBMC subsets. (A) Relative APOBEC3 mRNA expression levels in PBMC subsets. Median values for five healthy donors are depicted relative to mRNA levels in whole PBMCs from the same donor. (B) Relative mRNA expression in PBMCs and in T-cell, B-cell, and monocyte subsets. Median values for four healthy donors are depicted relative to mRNA levels in CEM-SS cells. Numbers above the bars indicate the absolute mRNA expression level per cell in CEM-SS cells. (C) Relative mRNA expression in peripheral T-cell subsets. Median values for four healthy donors are depicted relative to mRNA levels in Jurkat cells. Numbers above the bars indicate the absolute mRNA expression level per cell in Jurkat cells. (D) Relative mRNA expression levels in CD4+ T cells from five healthy donors over a time period of 12 months. Results are plotted relative to the first sample from donor 1, which is arbitrarily set to 1. Error bars indicate maximum and minimum values. All data are normalized to GAPDH mRNA.
FIG. 2.
FIG. 2.
Relative quantities of A3A to A3G, CD3, CD79a, and M-CFSR mRNA in tissue samples. (A) Relative mRNA expression levels of A3A to A3G, CD3, CD79a, and the M-CFSR gene in a panel of tissue cDNA samples (Clontech). Results are plotted relative to an arbitrary reference cDNA sample (Clontech). (B) Dot plots of A3F (left) and A3G (right) mRNA contents versus CD3 mRNA content in tissue cDNA samples. The symbols representing testis and ovary cDNA samples are depicted as open symbols. All data are normalized to GAPDH mRNA.
FIG. 3.
FIG. 3.
Induction of APOBEC3 mRNA over time in primary naïve CD4+ T cells cultured in the presence of IFN-α (pink line), IFN-γ (yellow line), IL-2 (green line), or CD3/CD28 costimulation (purple line) or without an inducing agent added (mock) (blue line). The induction of APOBEC3 mRNA expression is depicted, measured at different time points during culture relative to the start of culture. Mean values of naïve CD4+ T-cell isolations from five healthy donors are shown, and error bars represent standard errors of the means.
FIG. 4.
FIG. 4.
Induction of the A3A and A3G proteins over time in primary naïve CD4+ T cells cultured in the presence of IFN-α, IFN-γ, IL-2, or CD3/CD28 costimulation. Naïve CD4+ T cells were harvested at different time points during culture in the presence or absence (mock) of inducing agent and lysed for immunoblot analysis. The upper band in the A3A blot comigrates with full-length A3A in transduced T-cell lines (data not shown). HSP90 is used as a loading control. Depicted is a representative result from five donors tested.
FIG. 5.
FIG. 5.
Effects on A3G protein complex mass in primary naïve CD4+ T cells cultured in the presence of IFN-α (1,000 U/ml), IFN-γ (1,000 U/ml), IL-2 (20 U/ml), or CD3 and CD28 costimulation (1 μg/ml and 5 μg/ml, respectively). Naïve CD4+ T cells were harvested after culture in the presence or absence (mock) of inducing agent, lysed, fractionated on a sucrose gradient, and analyzed by immunoblotting. Mock and IFN-α- and IFN-γ-containing cultures were harvested after 30 h of culture; IL-2- or anti-CD3/anti-CD28-containing cultures were harvested after 72 h of culture. Left to right on the immunoblot represents samples from top (LMM) to bottom (LMM) in the gradient. Depicted is a representative result for three blood donors tested.
FIG. 6.
FIG. 6.
APOBEC3 mRNA expression in macrophages and DCs. Shown are data for the induction of APOBEC3 mRNA over time in MDMs (A) and DCs (B) cultured in the presence (pink line) or absence (mock) (blue line) of IFN-α. The induction of APOBEC3 mRNA expression is depicted, measured at different time points during culture relative to the start of culture. Mean values of MDMs (A) or DCs (B) from five healthy donors are shown; error bars represent standard errors of the means. (C) Induction of A3G and A3A protein expression over time in MDMs and DCs cultured in the presence or absence (mock) of IFN-α. Cells were harvested at the start and after 30 h of culture and lysed for immunoblot analysis. HSP90 is used as a loading control. Depicted is a representative result for five blood donors tested.

Similar articles

Cited by

References

    1. An, P., G. Bleiber, P. Duggal, G. Nelson, M. May, B. Mangeat, I. Alobwede, D. Trono, D. Vlahov, S. Donfield, J. J. Goedert, J. Phair, S. Buchbinder, S. J. O'Brien, A. Telenti, and C. A. Winkler. 2004. APOBEC3G genetic variants and their influence on the progression to AIDS. J. Virol. 78:11070-11076. - PMC - PubMed
    1. An, P., P. Duggal, L. H. Wang, S. J. O'Brien, S. Donfield, J. J. Goedert, J. Phair, S. Buchbinder, G. D. Kirk, and C. A. Winkler. 2007. Polymorphisms of CUL5 are associated with CD4+ T cell loss in HIV-1 infected individuals. PLoS Genet. 3:e19. - PMC - PubMed
    1. Anderson, J. L., and T. J. Hope. 2008. APOBEC3G restricts early HIV-1 replication in the cytoplasm of target cells. Virology 375:1-12. - PMC - PubMed
    1. Biasin, M., L. Piacentini, S. Lo Caputo, Y. Kanari, G. Magri, D. Trabattoni, V. Naddeo, L. Lopalco, A. Clivio, E. Cesana, F. Fasano, C. Bergamaschi, F. Mazzotta, M. Miyazawa, and M. Clerici. 2007. Apolipoprotein B mRNA-editing enzyme, catalytic polypeptide-like 3G: a possible role in the resistance to HIV of HIV-exposed seronegative individuals. J. Infect. Dis. 195:960-964. - PubMed
    1. Bishop, K. N., R. K. Holmes, and M. H. Malim. 2006. Antiviral potency of APOBEC proteins does not correlate with cytidine deamination. J. Virol. 80:8450-8458. - PMC - PubMed

Publication types

MeSH terms