Perceptual variation in umami taste and polymorphisms in TAS1R taste receptor genes
- PMID: 19587085
- PMCID: PMC3136006
- DOI: 10.3945/ajcn.2009.27462N
Perceptual variation in umami taste and polymorphisms in TAS1R taste receptor genes
Abstract
Background: The TAS1R1 and TAS1R3 G protein-coupled receptors are believed to function in combination as a heteromeric glutamate taste receptor in humans.
Objective: We hypothesized that variations in the umami perception of glutamate would correlate with variations in the sequence of these 2 genes, if they contribute directly to umami taste.
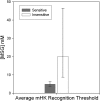
Design: In this study, we first characterized the general sensitivity to glutamate in a sample population of 242 subjects. We performed these experiments by sequencing the coding regions of the genomic TAS1R1 and TAS1R3 genes in a separate set of 87 individuals who were tested repeatedly with monopotassium glutamate (MPG) solutions. Last, we tested the role of the candidate umami taste receptor hTAS1R1-hTAS1R3 in a functional expression assay.
Results: A subset of subjects displays extremes of sensitivity, and a battery of different psychophysical tests validated this observation. Statistical analysis showed that the rare T allele of single nucleotide polymorphism (SNP) R757C in TAS1R3 led to a doubling of umami ratings of 25 mmol MPG/L. Other suggestive SNPs of TAS1R3 include the A allele of A5T and the A allele of R247H, which both resulted in an approximate doubling of umami ratings of 200 mmol MPG/L. We confirmed the potential role of the human TAS1R1-TAS1R3 heteromer receptor in umami taste by recording responses, specifically to l-glutamate and inosine 5'-monophosphate (IMP) mixtures in a heterologous expression assay in HEK (human embryonic kidney) T cells.
Conclusions: There is a reliable and valid variation in human umami taste of l-glutamate. Variations in perception of umami taste correlated with variations in the human TAS1R3 gene. The putative human taste receptor TAS1R1-TAS1R3 responds specifically to l-glutamate mixed with the ribonucleotide IMP. Thus, this receptor likely contributes to human umami taste perception.
Figures


Similar articles
-
Variation in umami perception and in candidate genes for the umami receptor in mice and humans.Am J Clin Nutr. 2009 Sep;90(3):764S-769S. doi: 10.3945/ajcn.2009.27462M. Epub 2009 Jul 22. Am J Clin Nutr. 2009. PMID: 19625681 Free PMC article. Review.
-
Nonsynonymous single nucleotide polymorphisms in human tas1r1, tas1r3, and mGluR1 and individual taste sensitivity to glutamate.Am J Clin Nutr. 2009 Sep;90(3):789S-799S. doi: 10.3945/ajcn.2009.27462P. Epub 2009 Jul 1. Am J Clin Nutr. 2009. PMID: 19571223
-
Genetic and molecular basis of individual differences in human umami taste perception.PLoS One. 2009 Aug 21;4(8):e6717. doi: 10.1371/journal.pone.0006717. PLoS One. 2009. PMID: 19696921 Free PMC article.
-
Tas1R1-Tas1R3 taste receptor variants in human fungiform papillae.Neurosci Lett. 2009 Feb 27;451(3):217-21. doi: 10.1016/j.neulet.2008.12.060. Epub 2009 Jan 6. Neurosci Lett. 2009. PMID: 19146926
-
Molecular insights into human taste perception and umami tastants: A review.J Food Sci. 2022 Apr;87(4):1449-1465. doi: 10.1111/1750-3841.16101. Epub 2022 Mar 17. J Food Sci. 2022. PMID: 35301715 Free PMC article. Review.
Cited by
-
Association between common variation in genes encoding sweet taste signaling components and human sucrose perception.Chem Senses. 2010 Sep;35(7):579-92. doi: 10.1093/chemse/bjq063. Epub 2010 Jul 21. Chem Senses. 2010. PMID: 20660057 Free PMC article.
-
A Matter of Taste: Lineage-Specific Loss of Function of Taste Receptor Genes in Vertebrates.Front Mol Biosci. 2017 Nov 28;4:81. doi: 10.3389/fmolb.2017.00081. eCollection 2017. Front Mol Biosci. 2017. PMID: 29234667 Free PMC article. Review.
-
Umami detection threshold among children of different ethnicities and its correlation with various indices of obesity and blood pressure.Curr Res Food Sci. 2022 Nov 4;5:2204-2210. doi: 10.1016/j.crfs.2022.11.006. eCollection 2022. Curr Res Food Sci. 2022. PMID: 36387604 Free PMC article.
-
Regulation of glutamate metabolism and insulin secretion by glutamate dehydrogenase in hypoglycemic children.Am J Clin Nutr. 2009 Sep;90(3):862S-866S. doi: 10.3945/ajcn.2009.27462AA. Epub 2009 Jul 22. Am J Clin Nutr. 2009. PMID: 19625687 Free PMC article. Review.
-
Taste buds: cells, signals and synapses.Nat Rev Neurosci. 2017 Aug;18(8):485-497. doi: 10.1038/nrn.2017.68. Epub 2017 Jun 29. Nat Rev Neurosci. 2017. PMID: 28655883 Free PMC article. Review.
References
-
- Ikeda K. Japanese patent 4805. 1908.
-
- Ikeda K. On a new seasoning. J Tokyo Chem Soc 1909;30:820–36
-
- Yamaguchi S. Basic properties of umami and effects on humans. Physiol Behav 1991;49:833–41 - PubMed
-
- Halpern BP. Glutamate and the flavor of foods. J Nutr 2000;130:910S–4S - PubMed
-
- Chaudhari N, Landin AM, Roper SD. A metabotropic glutamate receptor variant functions as a taste receptor. Nat Neurosci 2000;3:113–9 - PubMed
Publication types
MeSH terms
Substances
Grants and funding
LinkOut - more resources
Full Text Sources
Other Literature Sources
Medical
Miscellaneous

