. 2009 Sep;30(9):1620-7.
doi: 10.1093/carcin/bgp168. Epub 2009 Jul 8.

The prostaglandin receptor EP2 activates multiple signaling pathways and beta-arrestin1 complex formation during mouse skin papilloma development

Affiliations

The prostaglandin receptor EP2 activates multiple signaling pathways and beta-arrestin1 complex formation during mouse skin papilloma development

Kyung-Soo Chun et al. Carcinogenesis. 2009 Sep.

Abstract

Prostaglandin E(2) (PGE(2)) is elevated in many tumor types, but PGE(2)'s contributions to tumor growth are largely unknown. To investigate PGE(2)'s roles, the contributions of one of its receptors, EP2, were studied using the mouse skin initiation/promotion model. Initial studies indicated that protein kinase A (PKA), epidermal growth factor receptor (EGFR) and several effectors-cyclic adenosine 3',5'-monophosphate response element-binding protein (CREB), H-Ras, Src, protein kinase B (AKT) and extracellular signal-regulated kinase (ERK)1/2-were activated in 12-O-tetradecanoylphorbol-13-acetate (TPA)-promoted papillomas and that PKA and EGFR inhibition (H89 and AG1478, respectively) decreased papilloma formation. EP2's contributions to the activation of these pathways and papilloma development were determined by inhibiting endogenous TPA-induced PGE(2) production with indomethacin (Indo) and concomitantly treating with the EP2 agonist, CAY10399 (CAY). CAY treatment restored papilloma formation in TPA/Indo-treated mice and increased cyclic adenosine 3',5'-monophosphate and PKA activation as measured by p-CREB formation. CAY treatment also increased EGFR and Src activation and their inhibition by AG1478 and PP2 indicated that Src was upstream of EGFR. CAY also increased H-Ras, ERK1/2 and AKT activation, and AG1478 decreased their activation indicating EGFR being upstream. Supporting EP2's contribution, EP2-/- mice exhibited 65% fewer papillomas and reduced Src, EGFR, H-Ras, AKT and ERK1/2 activation. G protein-coupled receptor (GPCR) activation of EGFR has been reported to involve Src's activation via a GPCR-beta-arrestin-Src complex. Indeed, immunoprecipitation of beta-arrestin1 or p-Src indicated the presence of an EP2-beta-arrestin1-p-Src complex in papillomas. The data indicated that EP2 contributed to tumor formation via activation of PKA and EGFR and that EP2 formed a complex with beta-arrestin1 and Src that contributed to signaling and/or EP2 desensitization.


Figures

Fig. 1.
Fig. 1.
Comparison of TPA-induced PKA and EGFR signaling in surrounding skin and papillomas and the effects of their inhibition on papilloma formation. (A) Differences in p-CREB (Ser133), EGFR, p-EGFR (Tyr845), H-Ras, p-Src (Tyr416), p-AKT (Ser473) and p-ERK1/2 (Thr202/Tyr204) levels in papillomas and surrounding skin as determined by western blotting. Actin served as a control for protein loading and membrane transfer and each lane represents an individual mouse. Intensities of the bands were determined by densitometry and the relative intensities from three individual skins or papillomas are presented as mean value ± SD, *P < 0.05 versus surrounding skin. The data are representative of two independent experiments. (B) Inhibition of PKA and EGFR suppresses papilloma formation in initiated/promoted mice. Fifteen mice per group were topically treated twice per week with TPA, TPA/H89 (250 μg) or TPA/AG1478 (30 μg) for 15 weeks. The inhibitors in 200 μl of acetone were applied 30 min before the TPA in 200 μl acetone. Data are expressed as the mean ± SD (n = 15) of the number of papilloma per mouse in each group. *P < 0.05 versus TPA-treated mice.
Fig. 2.
Fig. 2.
CAY increased papilloma formation and epidermal hyperplasia. (A) PGE2 levels in skin were determined, using skin samples from CD-1 mice receiving one of the following treatments twice per week for 4 weeks: acetone, acetone/Indo, TPA (4.0 μg per treatment) or TPA/Indo. *P < 0.05 versus acetone-treated group; **P < 0.01 versus TPA-treated group. (B) CAY and PGE2 increased papilloma formation in TPA/Indo-treated mice. DMBA-initiated CD-1 mice (15 mice per group) were treated twice per week for 15 weeks with TPA, TPA plus Indo, TPA/Indo plus PGE2 or CAY (both 5 μg per treatment). The data are expressed as the number of papillomas per mouse (mean ± SD) at 15 weeks. *P < 0.01 versus TPA-treated group; **P < 0.01 versus TPA/Indo-treated group. (C) CAY induced a dose response in papillomas in TPA/Indo-treated mice. DMBA-initiated mice (15 mice per group) were treated twice per week for 15 weeks with TPA, TPA/Indo or TPA/Indo/CAY with the indicated doses of CAY. *P < 0.01 versus TPA-treated group, **P < 0.05 versus TPA/Indo-treated group. (D) Papillomas size distribution in TPA, TPA/Indo and TPA/Indo/CAY-treated mice [from (B) above]. (E) EP2 deficiency decreased papilloma numbers in initiated/promoted mice. WT (black bars) and EP2−/− mice (striped bars) were treated with TPA twice per week and the mean number of papillomas per mouse was determined weekly. *P < 0.05 versus WT group. (F) Hematoxylin and eosin-stained skin sections from CD-1 mice treated twice per week for 4 weeks with TPA. The scale bar is 10 μm. (G) TPA/Indo or (H) TPA/Indo/CAY (5 μg per treatment). (I) Bromodeoxyuridine (BrdU)-labeled cells in (F–H) (above). The mice were injected with BrdU for 2 h at 22 h after last TPA treatment. The skin sections were immunostained with an antibody against BrdU. BrdU-positive cells were counted in three random skin sections from each of five mice. Data are expressed as the mean ± SD (n = 3) of the number of stained cells per 100 basal cells in each group. *P < 0.05 versus TPA-treated group; **P < 0.01 versus TPA/Indo-treated group.
Fig. 3.
Fig. 3.
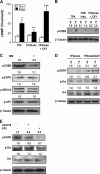
CAY increased cAMP/PKA and Src/EGFR activation in papillomas and surrounding skin. In (B–E), skin or two to three papillomas from three individual mice were combined (six to nine papillomas total) for analysis, and each experiment was repeated. (A) CAY increased cAMP levels in papillomas from TPA/Indo-treated mice. cAMP levels in papillomas and surrounding skin from mice treated twice per week for 15 weeks with TPA, TPA/Indo or TPA/Indo/CAY (5 μg per treatment) from Figure 2B above were determined. Samples were obtained 2 h after last treatment. *P < 0.05 versus surrounding skin; **P < 0.05 versus TPA-treated papillomas; ***P < 0.05 versus TPA/Indo-treated papillomas. (B) CAY restored p-CREB (Ser133) levels. The p-CREB (Ser133) levels and loading control, β-tubulin, were determined from papillomas (P) and surrounding skin (S) of mice treated as indicated. Fifty micrograms protein was loaded for western blotting from lysates prepared 24 h following the last treatment. (C) PKA inhibition decreased p-CREB levels in papillomas. Papillomas were generated by TPA/Indo/CAY promotion for 15 weeks and the treatment continued for two additional weeks with and without H89 (250 μg per treatment). Lysates were prepared from papillomas 24 h following the last treatment and p-CREB (Ser133), p-EGFR, p-ERK (Thr202/Tyr204) and p-AKT (Ser473) were detected by western blotting (50 μg protein). (D) CAY treatment increased p-EGFR and p-Src in TPA/Indo-treated papillomas. Initiated CD-1 mice (15 mice per group) were treated for 15 weeks with TPA, TPA/Indo or TPA/Indo/CAY (5 μg). Lysates were prepared 24 h following the last treatment from papillomas (P) and surrounding skin (S) and p-Src and p-EGFR detected by western blotting (75 μg protein). (E) Src kinase inhibition decreased p-EGFR levels in papillomas. Papillomas were generated by TPA/Indo/CAY (5 μg) treatment for 15 weeks and the treatment continued for two additional weeks with or without AG1478 (30 μg per treatment) or PP2 (30 μg per treatment). Lysates were prepared from papillomas 24 h following the last treatment and the levels of p-Src (Tyr416), p-EGFR (Tyr845) and the loading control, β-tubulin, detected by western blotting (75 μg protein).
Fig. 4.
Fig. 4.
EP2 contributed to the activation of H-Ras, ERK and AKT in papillomas (P) and surrounding skin (S). In (A–C), skin or two to three papillomas from three individual mice were combined (six to nine papillomas total) for analysis, and each experiment was repeated. (A) CAY treatment increased Ras, ERK1/2 and AKT activation in TPA/Indo-treated papillomas and surrounding skin. Lysates were prepared from skin and papilloma treated twice per week for 15 weeks with TPA, TPA/Indo or TPA/Indo/CAY and Ras-GTP (pull-down), p-AKT and p-ERK1/2 detected by western blotting (50 μg protein). (B) EP2 deficiency decreased Ras, ERK and AKT activation in papillomas. Western blotting (50 μg protein) of lysates was prepared from papillomas and surrounding skin from initiated/promoted WT and EP2−/− mice. (C) EGFR inhibition decreased Ras, ERK1/2 and AKT activation. Papilloma-bearing mice were generated by TPA/Indo/CAY (5 μg) for 15 weeks and the treatment continued for two additional weeks with or without AG1478 (30 μg per treatment). Lysates were prepared from papillomas 24 h following the last treatment and Ras-GTP (pull-down), p-AKT and p-ERK1/2 detected by western blotting (60 μg protein).
Fig. 5.
Fig. 5.
EP2 formed a complex with β-arrestin1 and p-Src. In (A–D), skin or two to three papillomas from three individual mice were combined (six to nine papillomas total) for analysis, and each experiment was repeated. (A) EP2 immunoprecipitated with β-arrestin1 from WT but not EP2−/− mice. EP2 immunoprecipitates were prepared from lysates (200 μg protein) of papillomas (P) and surrounding skin (S) from WT and EP2−/− mice and β-arrestin1 was detected by western blotting. (B) CAY increased EP2 and β-arrestin1 complex formation in p-Src immunoprecipitates of papillomas. Lysates were prepared from papillomas and surrounding skin from CD-1 mice treated twice per week for 15 weeks with TPA/Indo or TPA/Indo/CAY (5 μg). Twenty-four hours following the final treatment, p-Src immunoprecipitates (200 μg protein) were prepared and EP2, β-arrestin1 and p-Src detected by western blotting. (C) EP2, β-arrestin1 and p-Src complex formation was elevated in TPA-treated WT compared with EP2−/− papillomas. p-Src immunoprecipitates were prepared from lysates (200 μg protein) of papilloma and surrounding skin from WT and EP2−/− mice and the levels of EP2, β-arrestin1, p-Src and p-EGFR detected by western blotting. (D) p-EGFR formed a complex with p-Src independent of the EP2–β-arrestin1–p-Src complex. β-Arrestin1 immunoprecipitates were prepared from lysates (200 μg protein) of papillomas from WT mice and the levels of p-Src, EP2, p-EGFR and β-arrestin1 determined by western blotting.
Fig. 6.
Fig. 6.
Proposed model for EP2-mediated signaling. EP2 stimulation by ligand binding leads to Gαs activation and dissociation, which then caused AC activation, cAMP production and PKA activation. EP2 ligand binding also causes EP2 association with β-arrestin1 and Src leading to Src activation. Activated Src then activates EGFR leading the subsequent activation of H-Ras, ERK1/2 and AKT.

References

    1. Smith WL, et al. Cyclooxygenases: structural, cellular, and molecular biology. Annu. Rev. Biochem. 2000;69:145–182. - PubMed
    1. Hata AN, et al. Pharmacology and signaling of prostaglandin receptors: multiple roles in inflammation and immune modulation. Pharmacol. Ther. 2004;103:147–166. - PubMed
    1. Kawamori T, et al. Prostaglandin E receptor subtype EP(1) deficiency inhibits colon cancer development. Carcinogenesis. 2005;26:353–357. - PubMed
    1. Seno H, et al. Cyclooxygenase 2- and prostaglandin E(2) receptor EP(2)-dependent angiogenesis in Apc(Delta716) mouse intestinal polyps. Cancer Res. 2002;62:506–511. - PubMed
    1. Sung YM, et al. Lack of expression of the EP2 but not EP3 receptor for prostaglandin E2 results in suppression of skin tumor development. Cancer Res. 2005;65:9304–9311. - PubMed

Publication types

MeSH terms